Dynamics 365/CRM BI Solution
Note: ScienceSoft has stopped offering BI solution licenses to customers.
ScienceSoft team developed a universal, completely frontend data visualization solution for MS Dynamics CRM. It is flexible thanks to the well-planned architecture and allows for adding new features easily. Here, we will touch upon the solution’s key features and how to implement the tool in short, simple steps.
Key Features
- Supports all chart types (limited only by data). The chart types are based on d3.js library, therefore our solution is flexible enough to add as many charts as you want
- Visualizes any data type on any screen within the system
- Operates on multiple linked entities
- Supports data aggregation and statistics
- Offers a built-in charts designer as well as personal/system charts
- Able to group, share and print charts
- Offers system access control and overridden access control
- Provides full control over chart design (including Axis, labels, data points and so on)
- Shows high performance with large amounts of data
Guide
First of all, you need to import the solution to your organization’s MS Dynamics CRM installation.
After that, we recommend that you follow our instructions.
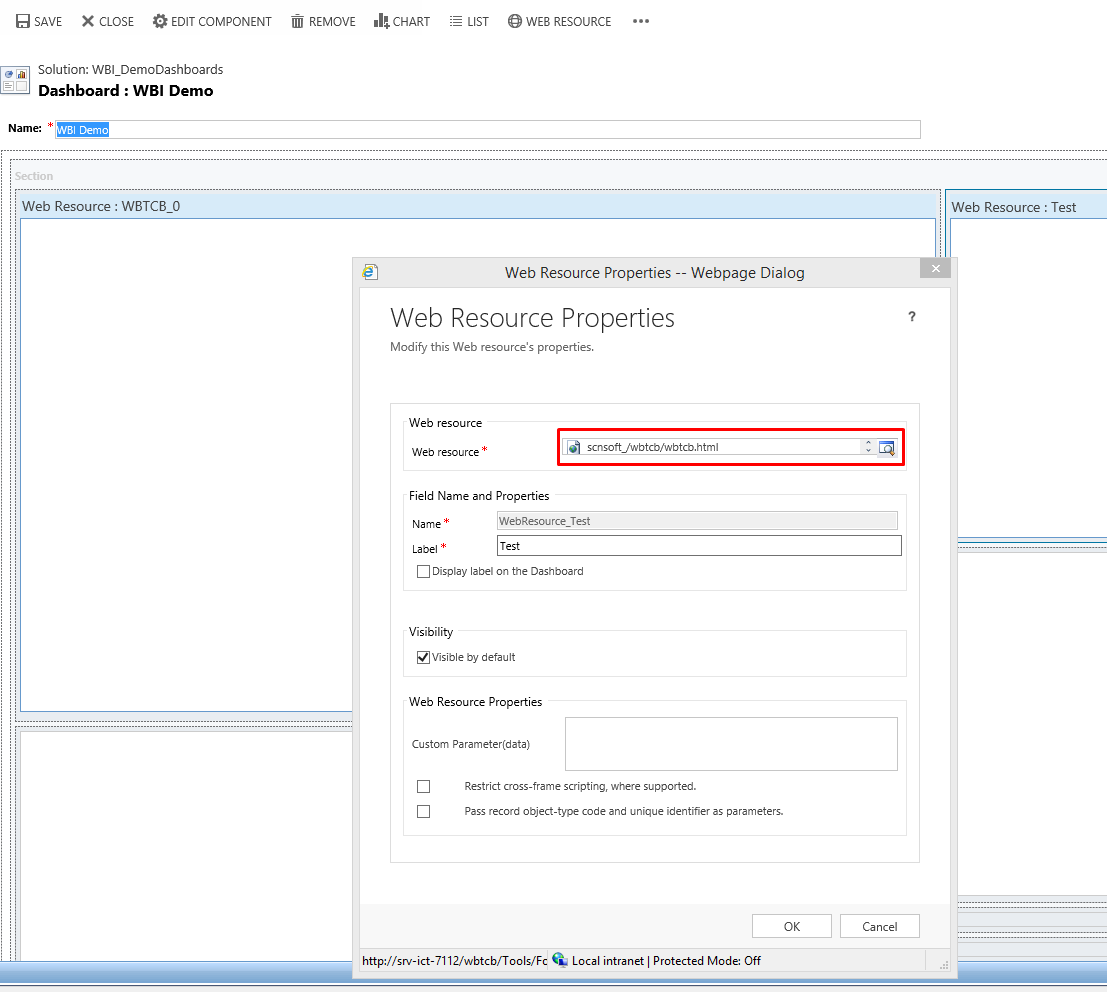
To add a new chart, you need to move to any dashboard or entity form where you would want to add the chart. After that, you add web resource (wbtcb.html) to a place where you would want to see the chart (see the picture below).
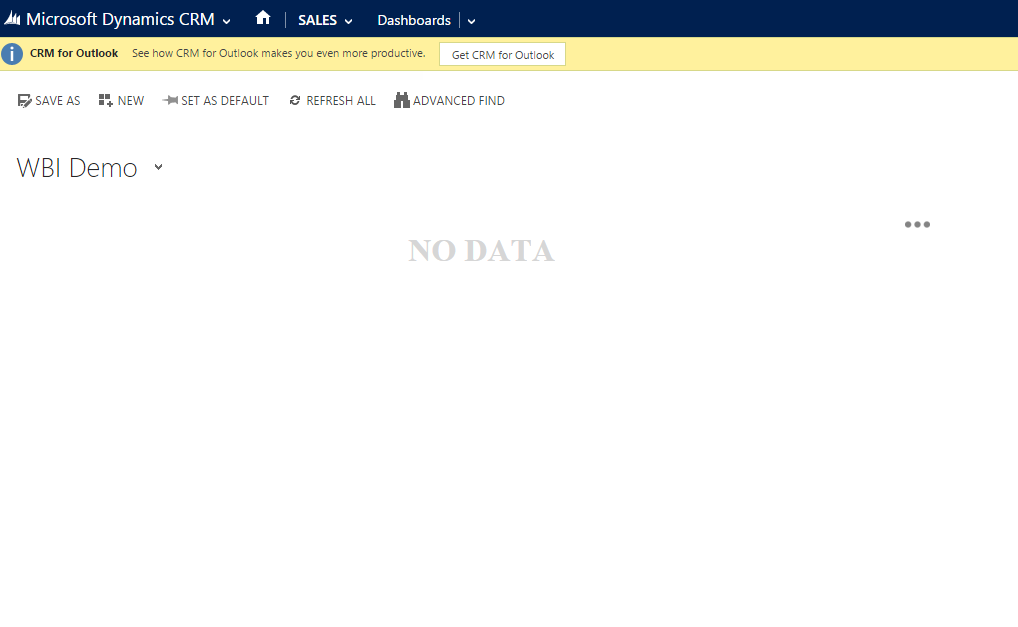
Then, you will need to save and import changes, and move to the dashboard or entity form where you have added the web resource. For example, you did that for the dashboard.
When the dashboard is loaded, you will see NO DATA, as on the picture below.
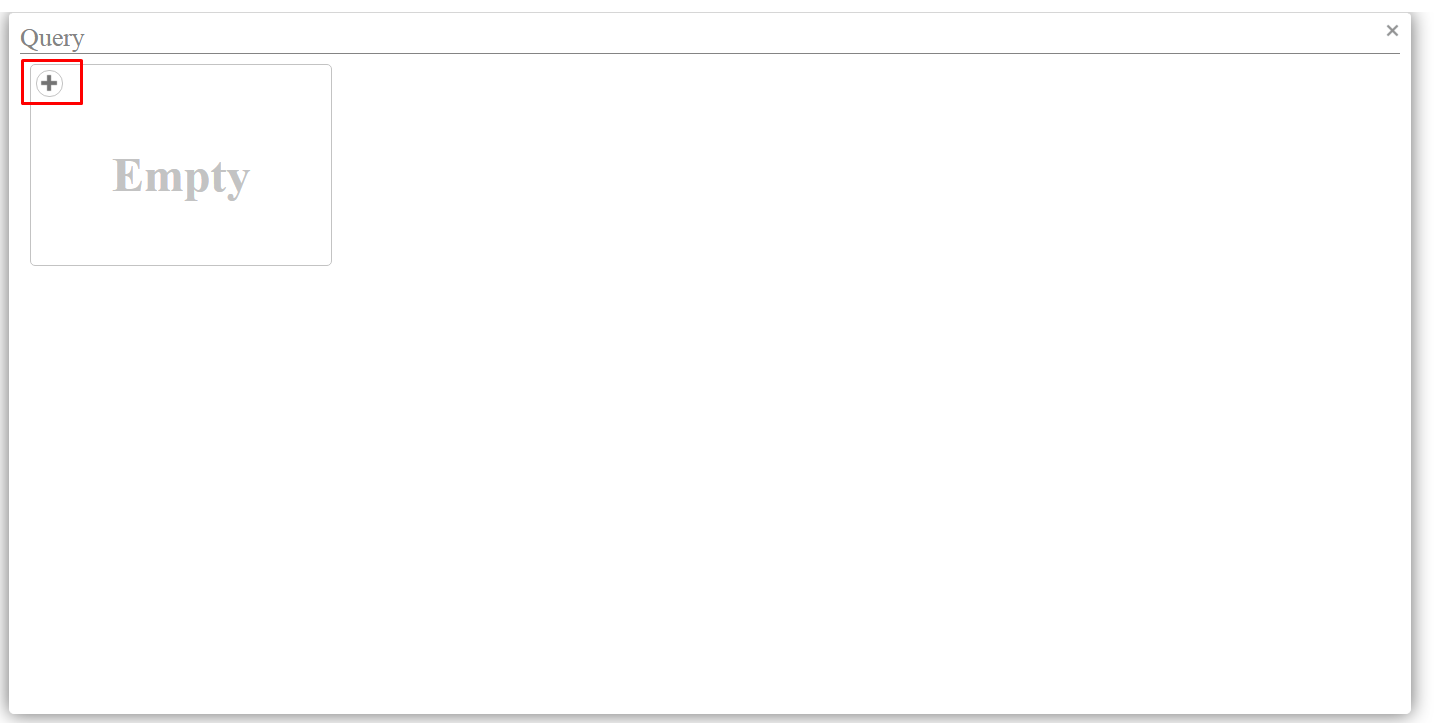
If you press the menu button, you will see the add button. Press it.
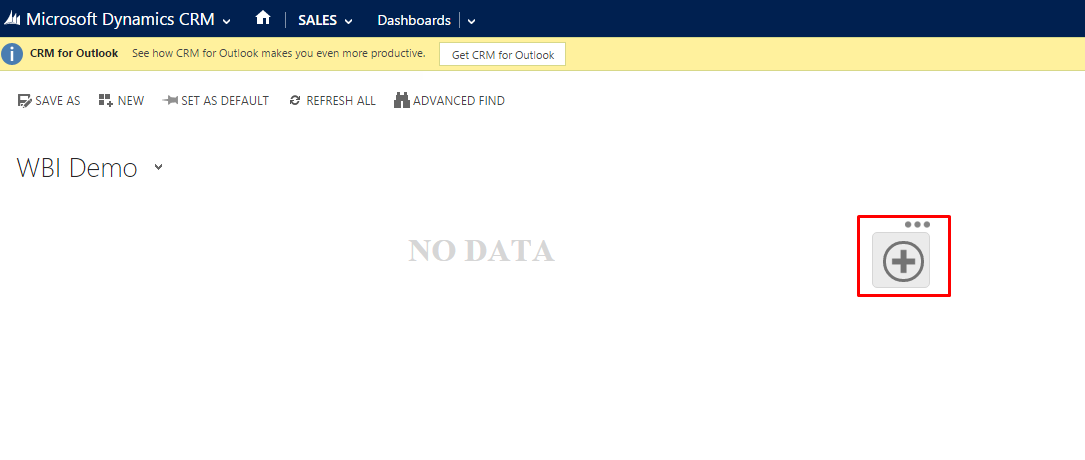
After that, you will see a pop-up window with a query builder. Here, you will have to define the query to CRM data. Press the add button as you see on the picture.
Then, you will see the builder where you will need to define the query. Choose the entity type and define the conditions if you want.
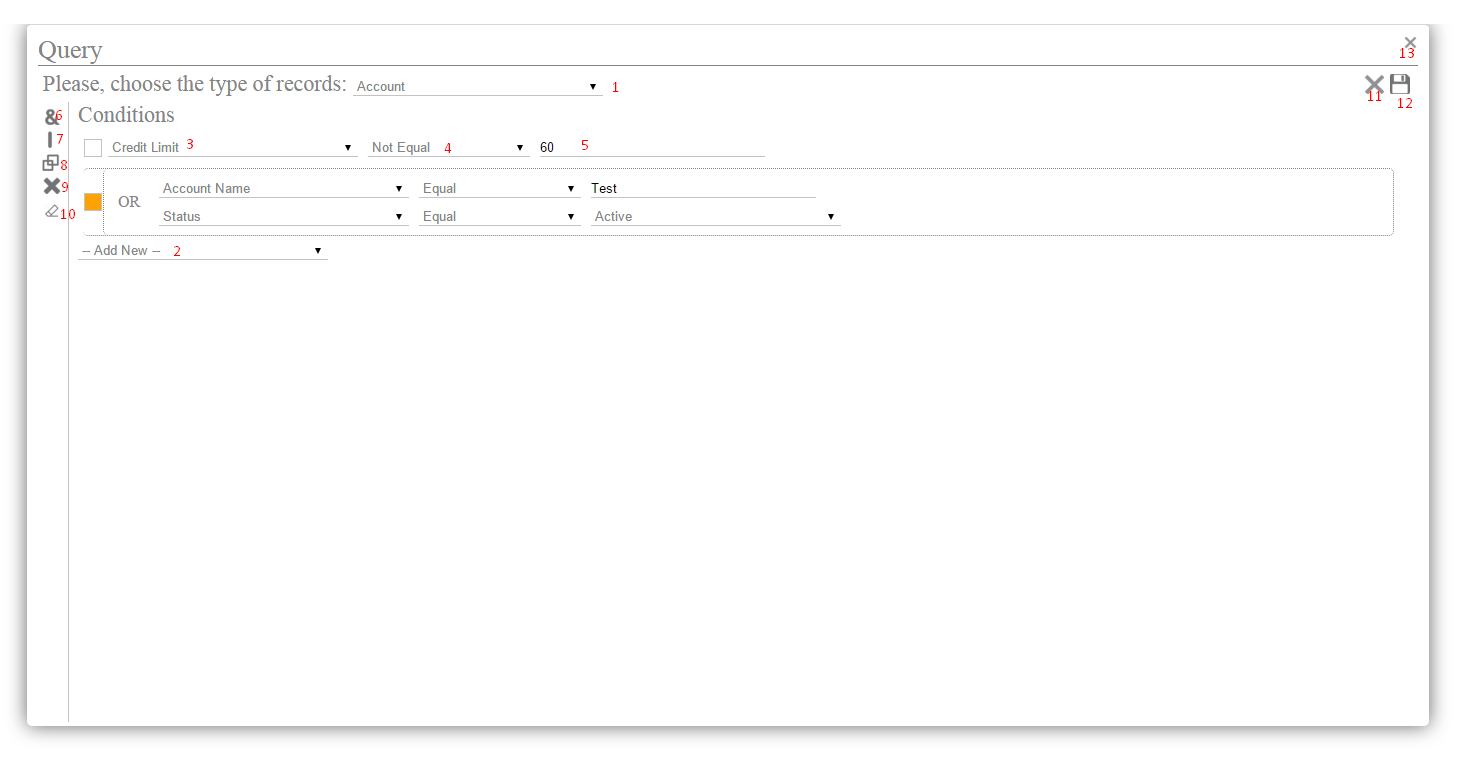
1 - Entity type control
2 - Attributes from selected entity
3 – Selected attribute (you can change it if you want)
4 – Operator type
5 – Value for condition
6 – AND – for join selected conditions as AND
7 – OR – for join selected conditions as OR
8 – Ungroup – ungroup selected group
9 – Delete selected condition or group
10 – Clear all conditions
11 – Cancel
12 – Save
13 – Return to main page
After you save the query, return back, where you can see the defined query. You can edit or delete it.
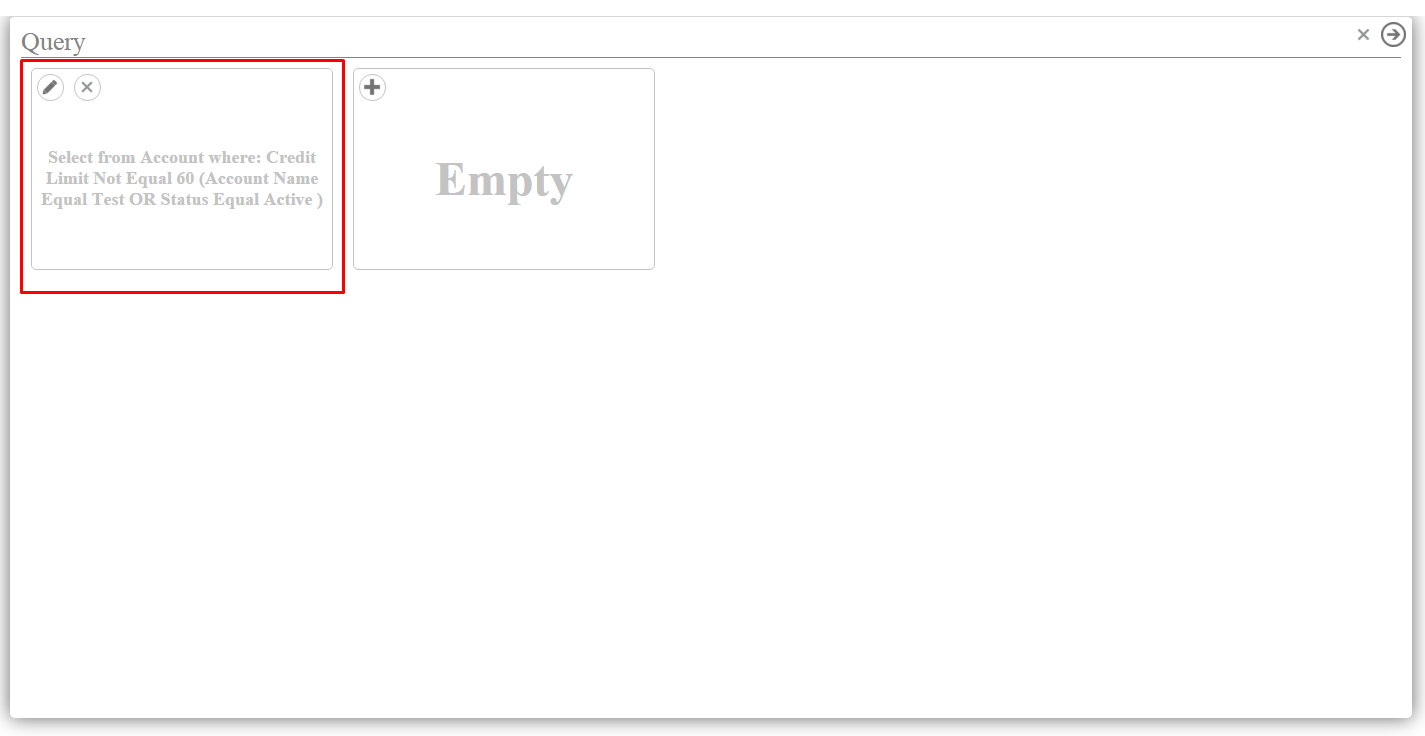
When you define and save the query, move on to the chart builder page.
Here you need to select the chart type, define the parameters for it and map data from your query.
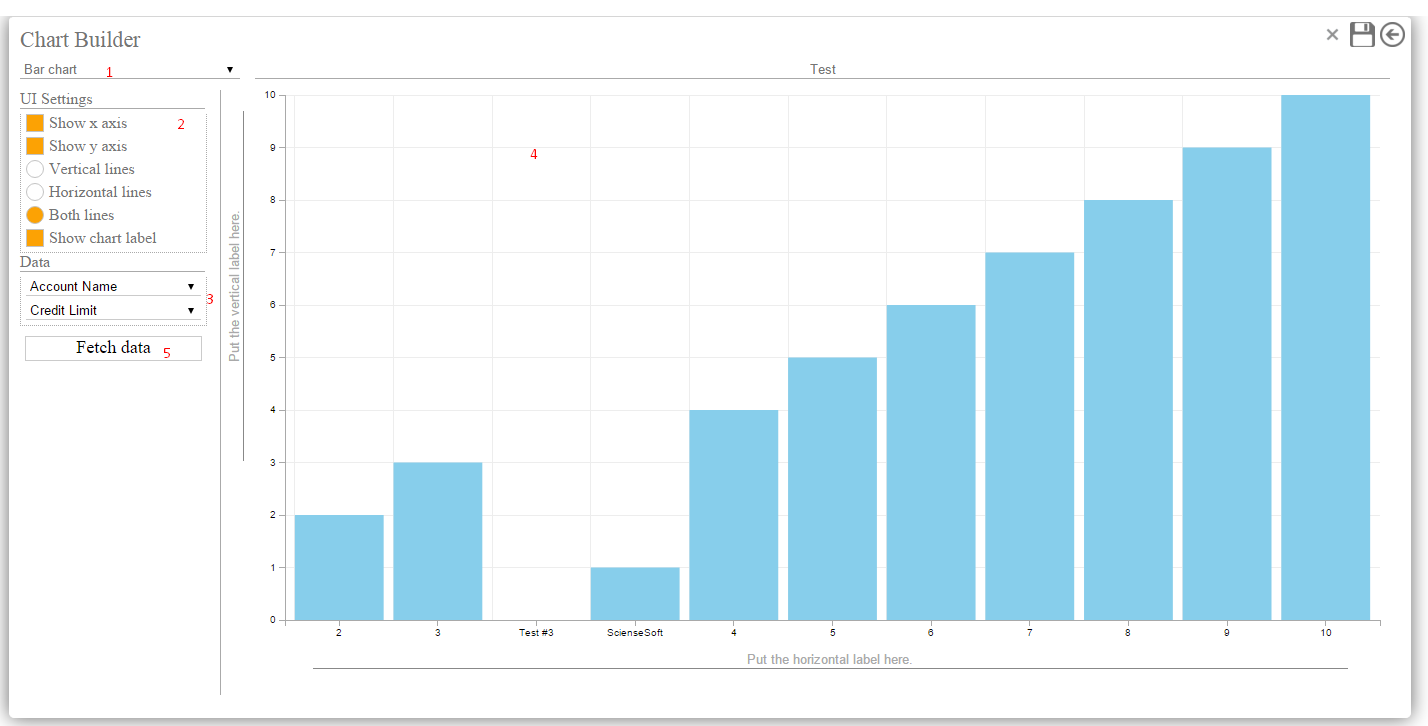
1 – Chart type
2 – Chart UI settings
3 – Data map
4 – Predifined chart
5 – Fetch data with your query that you can see in the preview
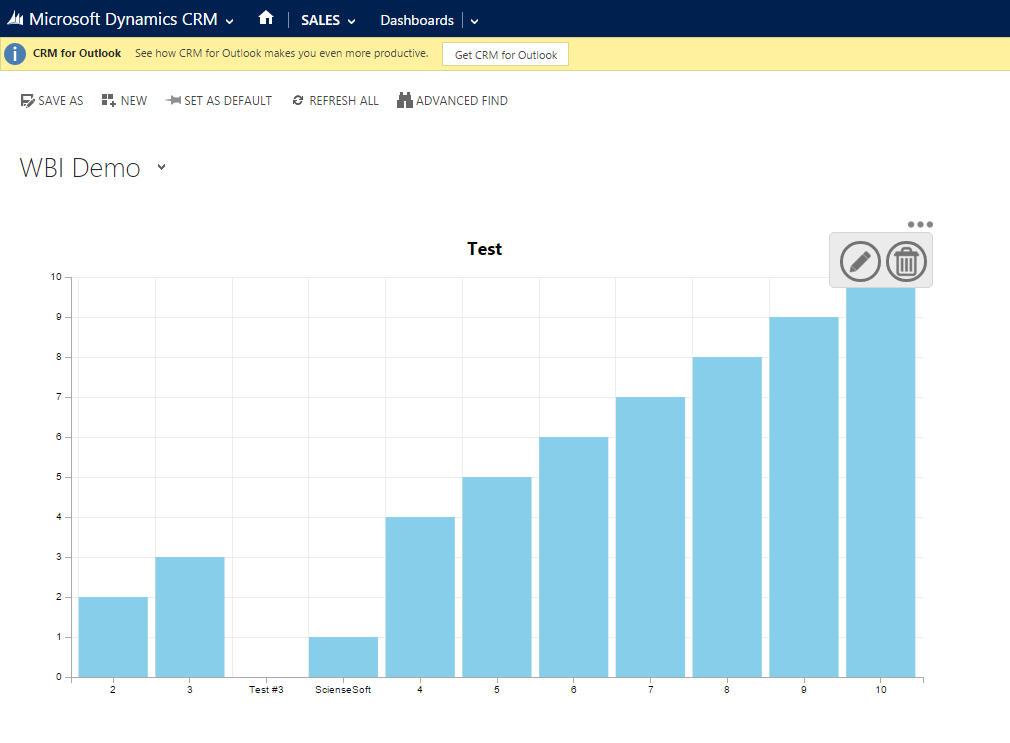
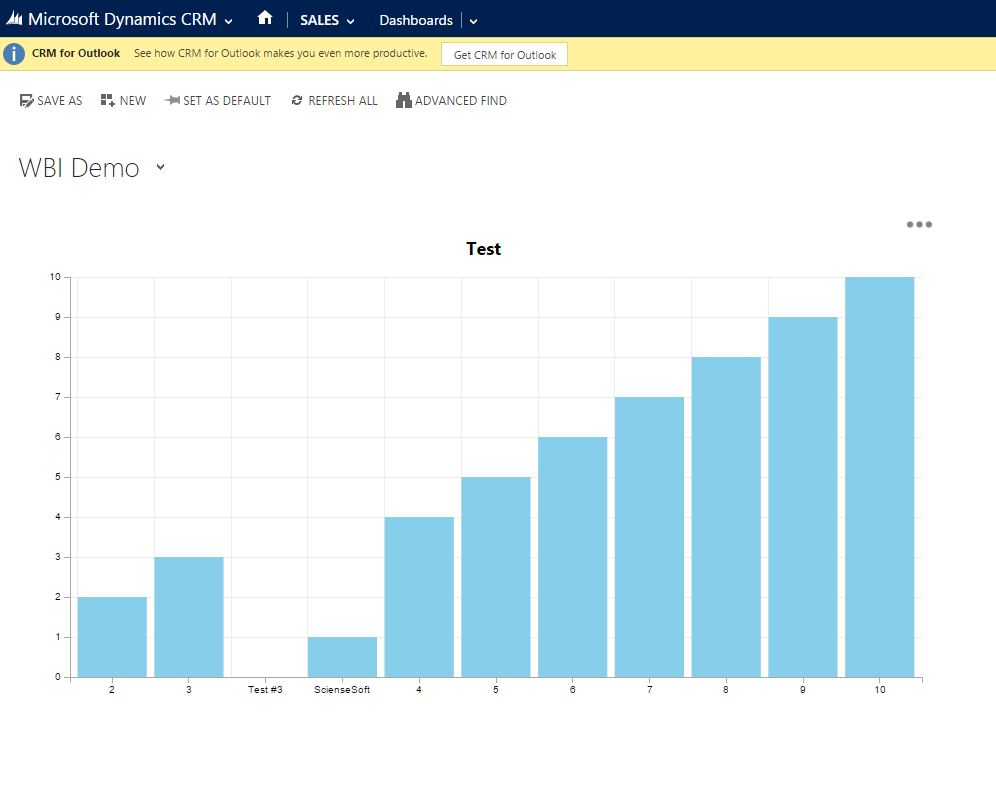
Now, save the chart. Upon returning to the main page, you will be able to see you chart.
You can edit it or delete