QLEAN Demo
|
Escape complex QRadar SIEM maintenance, data quality issues and inefficiencies in the performance of rules and reports with QLEAN. This advanced QRadar health check tool allows increasing your system’s ROI and lowering TCO. |
|
QLEAN Demo: What’s Inside?
QLEAN is ScienceSoft’s proprietary tool to systematically check QRadar’s health. With QLEAN demo, you’ll take a closer look at selected reporting tabs (Data Quality by Log Source, Data Quality by Device Type, Log Sources, Offense Analysis, Rules Performance and Data Quality: Unknown and Stored) which make QRadar performance management easy and transparent.
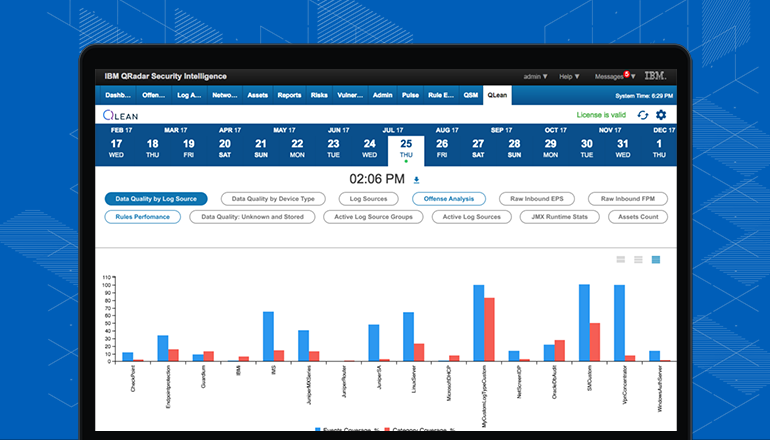
Data Quality by Log Source tab
Start exploring QLEAN with Data Quality by Log Source tab. It allows you to check the quality of data received from various log sources and the amount of log events that are collected but are not properly normalized and parsed by QRadar.
For example, two charts - The worst coverage (top 10) and The best coverage (top 10) - give you information about log sources having the lowest and the highest percentage of successfully recognized and categorized events.
Do you want to get more detailed information on log sources? The tables below the charts give the following details:
- Log source device types.
- Log source names created in QRadar.
- Relative importance (priority) of incoming events.
- Number of event types detected by QRadar.
- Number of event types supported by corresponding DSM (Device Support Module).
- Number of events from each log source for the last 24 hours.
- Event coverage by QRadar.
Pay special attention to Coverage column. It reflects the percentage of event types that are actually seen by QRadar against the supported ones. This information will help you to identify misconfigured log sources, the percentage of overlooked logs and events, thus you’ll start log source fine-tuning promptly.
Data Quality by Device Type tab
Identify problems common to all the log sources of the same type. For example, none of your Linux servers generates events in the “User login success” category, so you don’t get any data about users’ logins. This reveals an incorrect audit baseline that needs tuning. Issues indicated by 'Data Quality by Device Type' metric allow seeing if specific out-of-the-box DSM has to be updated, enhanced via LSE or your QRadar deployment needs custom DSM/LSX.
Log Sources tab
Get a single-page view on all the log sources connected to QRadar. Using the tab, you can quickly sort, search and filter through all the log sources, which is extremely time-consuming if fulfilled with standard QRadar capabilities.
The information from the tab helps to detect the following issues:
- Deleted or disabled log sources (if you register a sudden drop in the number of active log sources).
- Malfunctioning log sources (if you detect breaks in log sending).
- Modified log sources.
Offense Analysis tab
Get a clearly-arranged statistics of offenses originated by certain rules.
See the rules that trigger the most number of offenses in the Rules hit (top 10) chart. Our QLEAN demo allows you to study each rule thoroughly. One click on the rule, and you’ll see the rule description, logic and a list of triggered offenses with a unique offense identifier, the offense source (index) and the number of involved events, flows and offenses.
These insights complement the “Offenses” tab in QRadar UI and are useful for correlation rule fine-tuning.
Rules Performance tab
Get a snapshot of correlation rules performance.
Here you will find answers to such questions as:
- What rules trigger with the highest frequency? – Check Fired Rules count chart.
- Which rules have the longest processing time, causing heavy CPU usage? – Check Rules Average Execution Time chart.
- How long does it take for rule actions to execute? – Check Top Average Action Time table.
- How long does it take for a rule response to execute? – Check Top Average Response Time table.
Details you get from the tab allow you to eliminate incorrectly created, improperly fine-tuned rules, heavy rules with irrelevant building blocks and false-positives.
Data Quality: Unknown and Stored tab
Understand what events are collected but are not properly normalized and parsed by QRadar, hence do not bring any value and can’t be used to identify real offenses. The tab also lists all the log sources and device types that send data but are not properly discovered or identified by QRadar. Comparing the total number of event types corresponding to a particular log source or a device type with the number of normalized and parsed events, you can easily identify those types of devices and log sources that have issues.
Discover More
QLEAN demo has just introduced you to several features of our proprietary tool. If you want to discover more, contact our team to get deeper insights.