QLEAN for QRadar Tuning & Health Check
QLEAN: The Essence
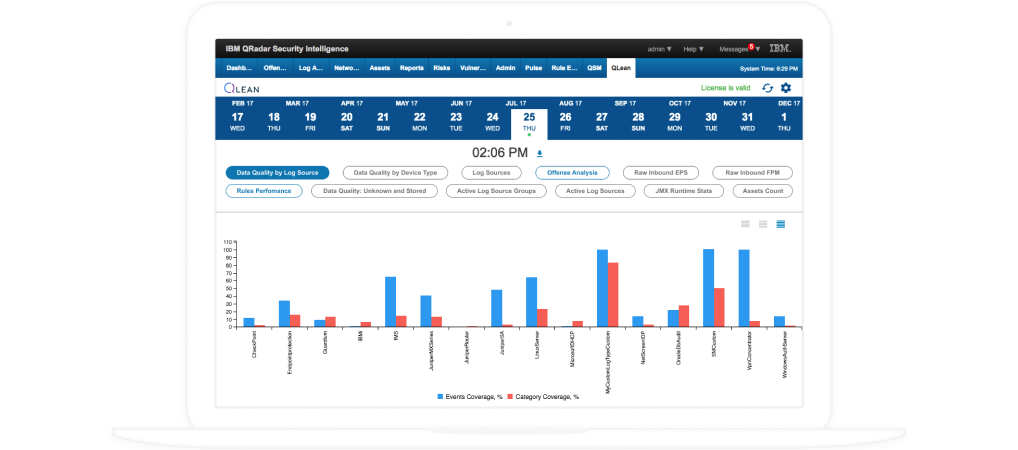
QLEAN is the advanced monitoring tool for IBM QRadar self-audit and fine-tuning that delivers a 360-degree view of your SIEM adding unique value to deployments of all sizes, identifies low performing components, and helps create actionable remediation steps.
New generation of QLEAN for QRadar
Easy to install and simple to use!
|
QLEAN for IBM® Security QRadar® SIEM |
|
Request a Free Trial License
To get your free 3-day QLEAN license, just fill out the form on https://qlean.io/#license
|
|
The most advanced QRadar health check and LEAN SOC automation solution to proactively improve SIEM performance and maintenance. |
What For?
- To avoid complex and costly maintenance (frees up about 250 hours or $25,000 a year per average deployment).
- To prevent inferior data quality.
- To sustain reliable performance.
- To investigate security threats & top offenses.
Qlean for Qradar Demo
Key Features
QLEAN (aka Health Check Framework for QRadar) provides security administrators with over 60 performance and behavioral metrics, as well as includes 25 health markers for quick assessment of the solution’s functioning. The tool ensures a comprehensive view of an organization’s SIEM system by letting security specialists detect operational deviations along with data losses, and helping to troubleshoot them promptly.
|
|
Analyze with health check reportQLEAN users get access to a comprehensive health check report that includes 37 performance and behavioral metrics. The Report offers an extended description of identified problems, hence helps security administrators to choose possible actions to recover the system’s operability. Each report generated by QLEAN contains a detailed analysis with the following performance indicators:
|
|
|
Diagnose with health markersThe markers draw an accurate portrait of the system, stressing such important aspects as:
|
The Benefits You Get
- Automation of QRadar maintenance routine.
- Holistic overview of the system performance and roadmap for tuning.
- Prompt issue diagnostics together with relevant recommendations to overhaul them.
- License efficiency and savings.
- QRadar operational transparency for analysts and managers.
- KPI on host uptime and availability.
- Increase of Log Sources Data quality per USD spent.
- Highly optimized and top performing QRadar system.
Get the Most Value from Your QRadar Deployment
17 years of our SIEM consulting experience showed that poor performance, low data quality along with complex and costly maintenance are the major factors that prevent companies from getting the most value from their QRadar deployments. It means that even with a SIEM solution in place, organizations often overlook critical security events occurring within their networks and still make considerable investments to support the system’s operability.
QLEAN was created to keep security administrators alerted to the system’s configuration and performance issues, and let businesses overcome the most frequent drawbacks hindering their SIEM effectiveness.
|
|
Faultless performanceQLEAN provides the system’s all-round profile by revealing pain spots that should be fine-tuned or reconfigured to ensure a higher level of protection:
|
|
|
Homogeneous dataQLEAN helps to improve the quality of data collected from numerous log sources. This allows to minimize risks of missing important log data and overlooking critical security offenses due to log source misconfiguration. Via dedicated performance metrics, QLEAN for IBM QRadar SIEM informs security administrators about:
|
|
|
Simplified maintenanceAdvanced operational analytics of the tool enables CISOs to stick to a proactive information security strategy and eliminates the necessity to create custom scripts and additional reporting tools. This allows security specialists to enhance QRadar’s performance with less time, effort and budget required to maintain the platform. The tool enables quick and timely improvements of the QRadar deployment by in-house security specialists, which allows companies to maintain excellent network protection. |
QLEAN at IBM Security App Exchange
QLEAN is officially available at IBM Security App Exchange. Please, follow the link to download it now.
Need More Information?
You are welcome to download the white paper about QLEAN for IBM Security QRadar SIEM and get additional information on the tool’s functionality and advantages along with the snapshots of the tool's dashboards and reports.
To get a detailed overview of the solution, please follow this link.
Contact Our SIEM Team
Feel free to address your questions on QLEAN to our SIEM consultants who will provide a free consultation, explain the capabilities and organize a live demo to demonstrate the solution in action.