Automated Reporting
Full Overview
Having experience in rendering BI services since 2005, ScienceSoft helps companies automate the report generation process and ensure timely delivery of business data to end users by implementing tailored BI solutions.

Automated Reporting in Brief
Automated reporting software is used to create and deliver BI reports without human involvement. Automating all the related processes, including data collection, processing, analysis, and visualization, such software allows businesses to achieve time and cost savings and minimize human-factor errors. When building automated reporting solutions, ScienceSoft follows the established project management practices, including those for project scoping, risk mitigation, and change request management.
Development costs for a BI solution with built-in automated reporting: from $80,000. Get a custom ballpark estimate for your case with our online cost calculator.
Implementation time: from 4 months.
Software for Report Automation: Core Functionality
Your company-specific and industry-specific needs and the required degree of automation of the report generation process will shape the feature set of the automated reporting solution. Below, we outline core features that form the base for end-to-end report automation with a BI solution.
![]()
Data preparation
- Automated data ingestion from data sources (CRM, ERP, HRMS, etc.) via pre-built data source connectors.
- Support for (near) real-time data ingestion to provide up-to-date data for reports.
- Support for on-demand and scheduled data refresh.
- Processing of heterogeneous (structured, semi-structured, unstructured) data.
- Built-in capabilities for data profiling, cleaning and transformation (identifying and removing invalid data, combining data from multiple sources and deduplicating redundant data, data standardization and harmonization, etc.) to ensure smooth data analysis and reporting.
![]()
Data storage
- Consolidating processed business data in the data warehouse in relational, columnar and multidimensional formats for company-wide analytical data querying and reporting.
- Storing consolidated department-specific data in data marts for streamlined department data analysis and report generation processes.
- Storing consolidated current data in the operational data store to enable operational intelligence.
![]()
Data analysis
- Online analytical processing (OLAP) of all data types to enable rolling up, drilling down, slicing and dicing business data.
- Data mining capabilities for identifying trends and patterns in huge sets of business data.
- Support for near real-time data analytics.
- Support for big data analytics.
- ML capabilities to create accurate forecasts and prescriptions, facilitate what-if scenario modeling, etc.
- Natural language analytical querying capabilities.
![]()
Data reporting
- Support for various report formats (PDF, Word, Excel, CSV, PowerPoint, XML, HTML, etc.).
- Report templates with pre-written KPIs for different types of business users (C-suite, department heads, middle managers, business analysts, etc.).
- Interactive reports with sub-reports, drill-down, drill-through and filtering functionality, hyperlinks, bookmarks or anchors, document maps, nested data regions, etc.
- Generating and distributing reports on a scheduled basis (daily, weekly, monthly, etc.).
- Event-based report generation and distribution (e.g., running a report when ETL is complete, running a report in case a customer cancels their account, or any time sales numbers reach abnormal levels).
- Embedded reporting capability to export ready reports into business applications, web portals, client apps, etc.
- Ad hoc reporting capabilities (running reports on demand).
- An extensive library of visuals (pie charts, slice charts, timeline charts, line graphs, data maps, scatter plots, Venn diagrams, etc.) for creating custom dashboards.
- Automated report updates with the interactive dashboarding capability.
- Mobile reporting.
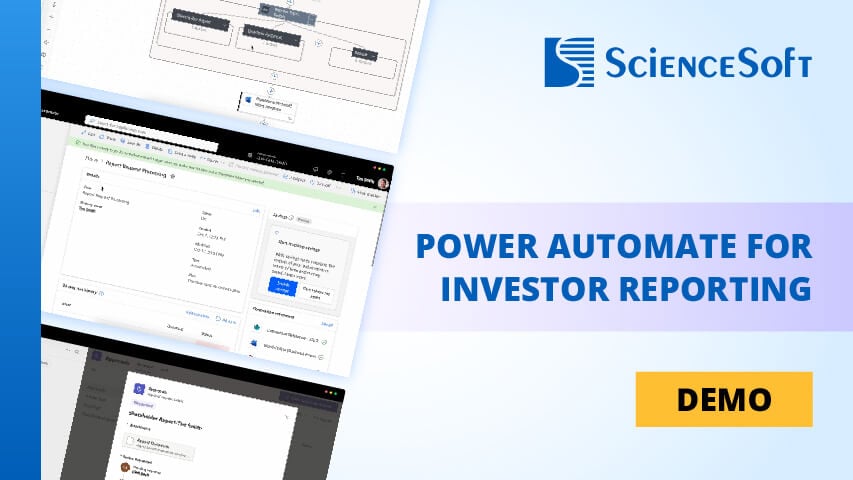
Automating Reporting With RPA: Demo
Watch ScienceSoft’s demo of an investor reporting solution powered by Microsoft Power Automate to explore how robotic process automation (RPA) boosts reporting efficiency and accuracy while giving business teams full control over report design and distribution.
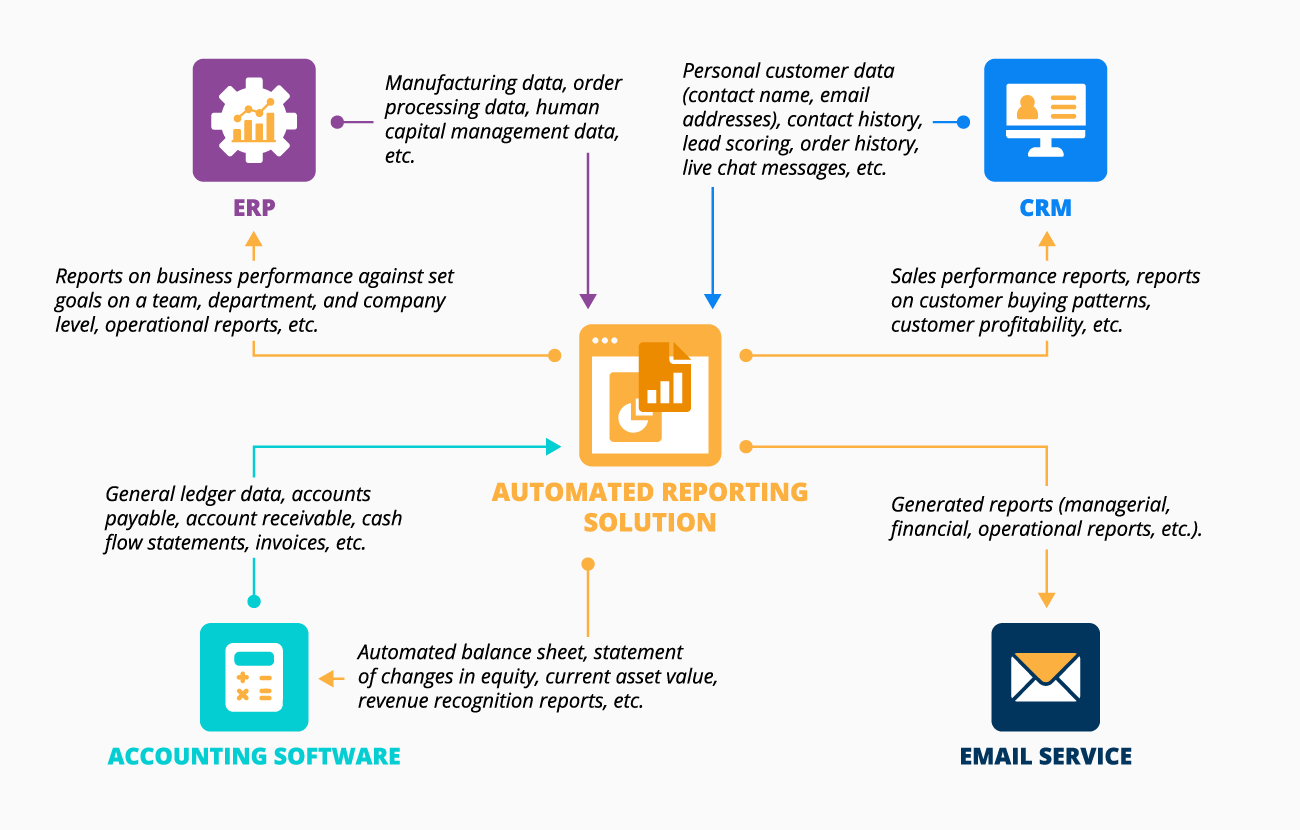
Common Integrations for Automated Reporting Solutions
For automated reporting solutions to work properly, ScienceSoft ensures essential integrations with the following systems:
- Enterprise resource planning software – for supporting end-to-end visibility into a company’s business operations and the data-driven management of the company’s processes in production, order fulfillment, human capital management, etc.
- Accounting software – for supporting comprehensive financial data analysis, financial performance management, financial planning and budgeting, etc.
- Customer relationship management software – for supporting analytics-driven decision-making, accurate forecasting and planning in marketing and sales management activities.
- Email service – for enabling automated emailing of business reports on a pre-determined schedule or triggered by certain events.
Success Factors for Report Automation Software
Relying on experience in business intelligence since 2005, ScienceSoft has defined the core factors that we cover in our projects to ensure the success of automated reporting solutions:
![]()
Data security
To safeguard business data from unauthorized access, comply with regulatory requirements (GDPR, HIPAA, etc.), ensure safe data sharing and accessing, the automated reporting solution should offer:
- Role-based access control.
- Configurable permission settings applied to users, reports, dashboards, shared data sources or data sets.
- Support of different user identification methods (password-based, multi-factor, token-based, etc.).
- User activity auditing.
- Data encryption at rest and in transit and dynamic data masking.
![]()
Sets of pre-built connectors and easy-to-use APIs
To provide seamless connection of the reporting tool with business-critical data sources and ensure uninterrupted data flow.
![]()
Highly customizable reports and dashboards
To easily adjust reporting output according to user roles (data granularity for different users, varying sets of KPIs, etc.).
![]()
Well-established data governance
To ensure a company’s data is correct, complete, timely, secure, and used to its maximum value.
![]()
User-defined report delivery schedules
To deliver reports when they are mostly needed without overburdening the solution – on a real-time, hourly and daily basis to operational business users (sales reps, equipment inspectors, marketing specialists, etc.) and weekly, monthly, quarterly to senior managers for strategic decision-making.
![]()
Mobile capabilities
To enable native experience while accessing reports via various mobile devices.
Costs and Benefits

The cost of development for a full-scale BI solution with built-in report automation capabilities can range from $80,000 to $100,000,000.
Want to estimate the cost of your future automated reporting solution?
The implementation cost of the reporting solution depends on the following factors:
- Number of data sources (CRM, ERP, finance and accounting software, etc.).
- Data volume.
- Complexity of data cleansing and data transformation procedures.
- Types of analytics required.
- Number and complexity of generated reports.
- Number and complexity of used dashboards.
- User permission system complexity.
- User training, etc.
Benefits, which report automation brings:
Technologies ScienceSoft Recommends for Building an Automated Reporting Solution
Below, we list the most popular tools that we use in our projects:

Microsoft Power BI
Best for
Reporting based on multiple data sources.
Description
- Free pre-built connectors with 120+ data sources including Excel, Salesforce, Azure Synapse Analytics, Google Analytics, Apache Hive, etc.
- Customizable reports and dashboards.
- Support for real-time data streaming to enable updating dashboards in real time.
- Automatic export and distribution of Power BI reports in a variety of formats with Power Automate.
- Enabling business users to subscribe for automatic reports at scheduled intervals.
- Incorporating Power BI content into other applications with Power BI Embedded.
- Fine-grained data access control.
- Available as a SaaS option running in Azure or as an on-premises option in Power BI Report Server.
DEMO: Watch our Power BI demo.
Pricing
- Power BI Desktop – free.
- Power BI Pro – $9.99/user/month.
- Power BI Premium – $4,995/dedicated storage and compute resources/month, $20/user/month.
Power BI is currently available as part of the Office 365 Enterprise E5 version.

Tableau
Best for
Advanced report visualization.
Description
- Native connectors to 75+ data sources, including Amazon Redshift, Cloudera, Google Analytics, Microsoft Excel, MySQL, etc.
- Ready-to-use dashboard templates.
- Support for custom dashboard creation.
- Interactive reports and dashboards with out-of-the-box animations.
- Vast sharing and collaboration capabilities (online collaboration on Tableau content, sending static reports and interactive dashboard to trusted Tableau users, etc.).
- Embedding analytics reports into web portals, corporate and customer-facing applications.
- Robust security features (authentication at the user and user group level, fine-grained permissions control over data, content, objects, etc.).
Pricing
- Tableau Creator – $70/user/month.
- Tableau Explorer – $35/$42*/user/month.
- Tableau Viewer – $12/$15*/user/month.
* - depending on the product deployment model.

Qlik Sense
Best for
Multi-cloud deployment.
Description
- Broad data connectivity (including big data streams, file-based data, on-premises or cloud data).
- Built-in scheduled and on-demand batch data updates.
- Incremental data reloads from streaming data sources in real-time with Qlik Data Integration Platform.
- Supporting automatic report delivery (scheduled or event-based basis) with the Qlik NPrinting module.
- AI-based data preparation, analysis and visualizations creation.
- Mobile and embedded analytics capabilities.
- Row and column-level security, data encryption at rest.
- Natural language interaction.
Pricing
- Qlik Sense Business – $30/user/month.
- Qlik Sense Enterprise SaaS pricing by a direct request to the vendor.
Consider Professional Services for Automated Reporting Software Implementation
Since 2005, ScienceSoft has been delivering business intelligence solutions to help companies automate their report generation process for streamlined operational efficiency and considerable cost and time savings.

Automated reporting software consulting
- Analysis of needs for automated reporting.
- Automated reporting solution conceptualization.
- Solution architecture design and tech stack selection.
- Solution implementation planning (risk management planning, defining KPIs for measuring automated reporting software quality, etc.).
- Business case creation, including cost estimation, time budget estimates.

Automated reporting software implementation
- Analysis of needs for report automation and elicitation of automated reporting solution requirements.
- Conceptualization of the automated reporting solution.
- Solution architecture design and tech stack selection.
- Solution development and integration with required data sources.
- Automated reporting software quality assurance.
- After-launch support and optimization.
About ScienceSoft
ScienceSoft is an AI transformation and software development company headquartered in McKinney, Texas. With experience in BI consulting services since 2005, we design and build tailored solutions for report automation. Being ISO 9001 and ISO 27001-certified, ScienceSoft relies on a mature quality management system and guarantees that cooperation with us does not pose any risks to our clients’ data security.
