Analytics in Energy & Utilities
A Complete Overview
In data analytics and AI since 1989, ScienceSoft builds custom analytics solutions to help energy & utilities companies gain full visibility into the performance of distribution networks and production sites, optimize asset utilization, reach ESG goals, and elevate customer experience.

Analytics for energy and utilities is needed to make informed decisions based on resource generation, distribution, and consumption data, equipment performance metrics, environmental impact, compliance regulations, and market situation.
Custom analytics solutions enable E&U organizations to integrate diverse data sources into a unified view and benefit from tailored analytics capabilities (including those based on proprietary ML models) for demand forecasting, DSM, predictive maintenance, and more.
- Implementation time: 2–6 months for an MVP.
- Implementation costs: $100,000–$1,000,000+, depending on the solution’s scope. Use our free online calculator to get a ballpark estimate for your case.
- Essential integrations: ERP, SCADA, MDM system, asset management system, SCM software, customer information system.
- ROI: up to 1600% (16:1) over three years when implementing comprehensive diagnostic and predictive maintenance solutions for large energy producers and T&D providers.
Key Analytics Software Capabilities for Energy & Utilities Companies
Energy and utilities analytics software development typically requires creating a significant share of custom code as each solution needs to be adapted to the specifics of the industry sector and each individual company. Below, our consultants list basic and advanced analytics features commonly requested by our clients in the E&U domain.
![]()
Power transmission and distribution analytics
-
Tracking grid reliability metrics (e.g., SAIDI, SAIFU, CAIDI).
- Calculating transmission and distribution losses.
- Calculating and predicting the share of energy from DERs and assessing their impact on the grid.
- Issue root cause analysis (e.g., for voltage fluctuations, outages).
- Predictive maintenance for transformers, generators, power towers, and other grid assets.
- Load demand forecasting and scenario modeling.
- Dynamic pricing optimization.
- Automated network load adjustment.
- Instant alerts on urgent and potential issues, such as outages, congestion, and capacity constraints.
![]()
Water supply analytics
-
Water supply monitoring (e.g., energy consumption per unit of water produced, NRW percentage, water loss rate).
- Real-time monitoring of water supply networks across various parameters (e.g., flow rates, pressure levels).
- Leak detection and localization with prompt alerting.
- Water demand forecasting and what-if modeling.
- Predictive maintenance of network assets, such as pumps, valves, and reservoirs.
![]()
Heating analytics
-
Real-time monitoring of heating network performance across multiple parameters (e.g., load, capacity, heat consumption, flow rates).
- Predictive maintenance for heat exchangers, boilers, pumps, valves, and other equipment.
- Detecting potential heat loss reasons (e.g., leaks, inadequately sized steam traps) based on the analysis of temperature differentials, flow rates, and insulation levels.
- Heat demand forecasting based on identified heat consumption patterns and weather modeling results.
- Real-time alerts on anomalies (e.g., sudden fluctuations in temperature or flow rates).
![]()
Upstream sector analytics
- Estimation of oil and gas reserves at the potential drilling location.
- EUR forecasting.
- Real-time monitoring of oil & gas production.
- Remote equipment monitoring and predictive maintenance.
- Production rates forecasts.
Midstream sector analytics
- Continuous monitoring of storage tanks and distribution pipelines with alerts on issues like leaks or overfills.
- Analytics of the supply chain, energy consumption, and inventory management.
Downstream sector analytics
- Process efficiency analytics for petrochemicals production and refinery.
- Quality control.
- Monitoring transportation safety and efficiency.
- Predictive maintenance of shop floor and transportation equipment.
- Supply-demand forecasts and what-if models based on historical demand trends, weather conditions, and market changes.
![]()
Power plant analytics
-
Specialized monitoring and analytics solutions for coal, natural gas, hydroelectric, nuclear, geothermal, wind, solar, biomass, and CHP plants.
- Analyzing energy and fuel consumption patterns within the power plant.
- Analyzing the condition and performance of assets (e.g., boilers, heat exchangers, turbines, reactors).
- Predictive asset maintenance.
- Combustion optimization insights (for coal power plants).
- Continuous safety analytics (e.g., tracking temperature and pressure within systems, gas concentration and radiation levels).
- Monitoring emission levels.
- Instant alerting on issues with automated emergency shutdowns.
![]()
Asset analytics
-
Monitoring asset KPIs, e.g., asset uptime, maintenance costs as a percentage of asset value, MTBF, MTTR.
- Continuous analytics of asset performance and state with insights into utilization optimization.
- Predictive and preventive asset maintenance.
- Asset lifecycle cost analysis.
- Identifying root causes of asset inefficiencies and failures (e.g., operating errors, environmental factors).
- Predicting the end of assets’ useful life.
- Immediate alerting on asset performance issues.
![]()
Sustainability analytics
- Tracking the emissions of air pollutants (CO2, NOx, SO2).
- Water quality analytics (e.g., pH levels, turbidity, contaminants).
- Analyzing data on waste generation, composition, and disposal.
- Monitoring noise levels.
- Assessing the environmental impact of potential projects and policies through what-if scenarios.
- Comparing the level of environmental impact against thresholds set by internal policies and regulatory authorities (e.g., EPA, FERC).
- Sending instant non-compliance alerts.
![]()
- Multidimensional customer segmentation (e.g., by demographics, location, industry, company size).
- Identifying customer- and segment-specific resource usage patterns, such as peak demand periods and seasonal variations.
- Customer lifetime value analysis.
- Customer churn prediction.
- Customer sentiment analysis based on data from surveys, review platforms, and call transcripts.
- Performance insights for demand-side management (DSM) programs to optimize program design, target audience selection, and incentive structures.
- Personalized energy usage and cost analytics for customer portals and mobile apps.
- AI-powered recommendations on customer-specific billing options (e.g., fixed monthly payment plans, time-of-use pricing).
![]()
- Analyzing costs across all business directions (e.g., planned costs of maintenance and business development).
- Segmenting costs by labor, maintenance, fuel, overhead, and other expense categories.
- Revenue analytics with revenue stream attribution (e.g., by customer segment, service offering).
- Profitability analytics.
- CAPEX and OPEX budget analysis.
- Financial risk management.
- Insights into the minimization of tax liabilities (e.g., pinpointing relevant tax credits and incentives).
- Payroll analytics with employee performance vs. compensation benchmarking.
- Financial planning and forecasting.
- Financial performance and financial compliance reporting.
- Scenario analysis for optimized energy trading operations.
![]()
Fraud analytics
- Identifying cases of tampering, meter bypass, and unauthorized access by detecting anomalies and outliers in meter readings.
- Detecting fraudulent customer behavior through the analysis of resource consumption patterns, service requests, and payment history.
- Identification and monitoring of at-risk customer segments.
- Identifying discrepancies in billing data.
- Instant alerts on fraud detection.
![]()
- Continuous monitoring of inventory levels (e.g., fuel, spare parts, chemicals).
- Inventory demand forecasting based on asset condition and performance, historical demand, and environmental data.
- Tracking and optimization of logistics operations to ensure timely inventory availability.
- Supplier performance insights.
- Monitoring the adherence of SCM processes to the required ESG regulations.
- What-if scenarios of delivery routes based on historical SCM data.
![]()
HR management analytics
- Tracking recruitment and hiring KPIs (e.g., time-to-fill, cost-per-hire).
- Identifying the sources of high-quality hires (e.g., referrals, job boards).
- Evaluating employee performance against set goals and other internal parameters and pinpointing top-performing employees.
- Workforce resource forecasting based on past and current service requests and employee vacation schedules.
- Tracking employee participation in training and development activities and evaluating their impact on productivity.
- Identifying skill gaps based on data about employee certifications and training.
- Tracking employee attrition rates and providing insights for efficient retention strategies.
- Identifying trends and root causes in safety incident data.
- Insights into employee satisfaction and engagement based on survey data analysis.
Essential Integrations for Energy & Utilities Analytics
Energy and utilities analytics software benefits from direct integrations with other enterprise systems, which can vary depending on the industry sector, the software and hardware systems in place, and more. Below, our specialists outline the core data sources for integration.
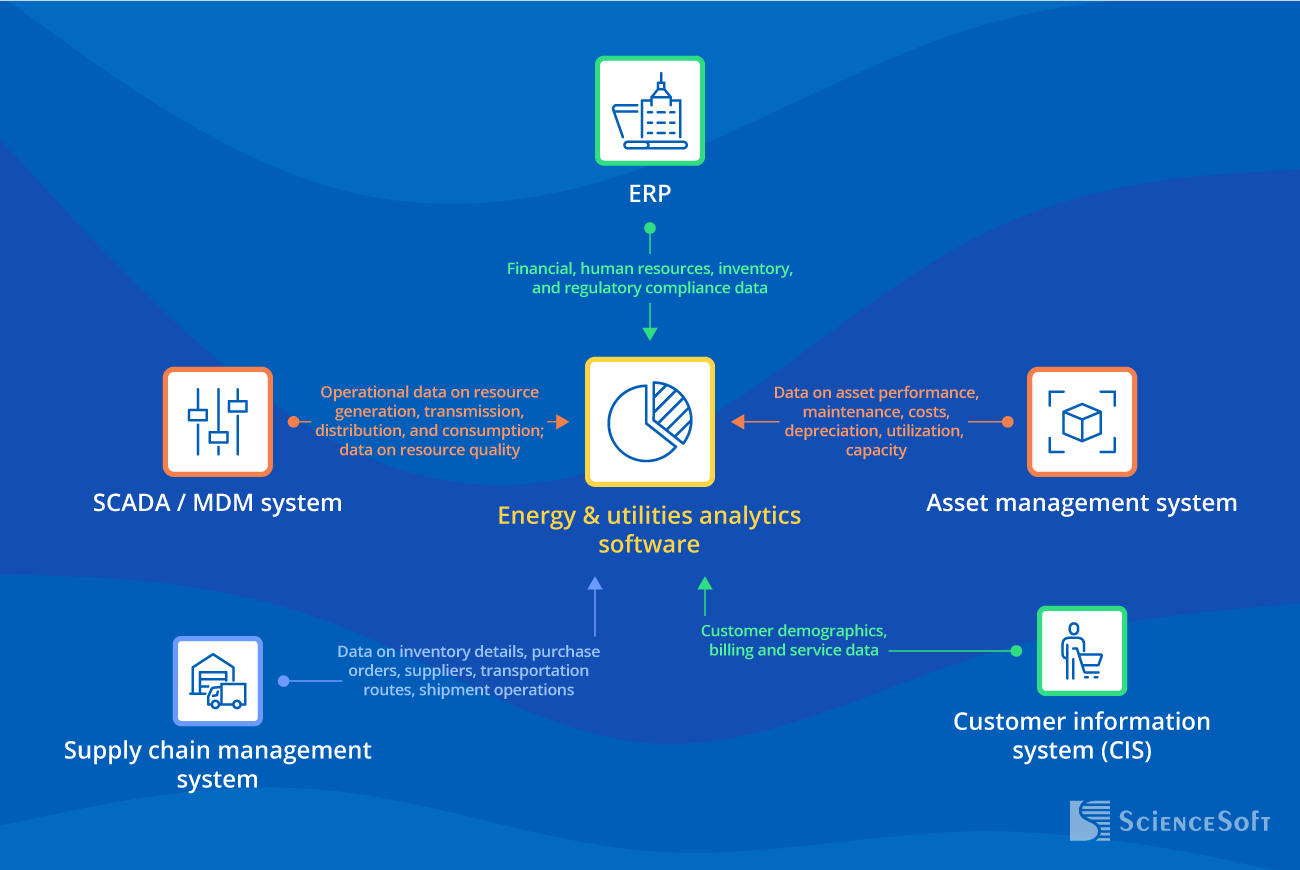
ERP
- To enable financial reporting and forecasting.
- To support accurate budget planning.
- To monitor compliance with environmental protection regulations.
- To optimize inventory management.
- To get insights into HR management processes.
SCADA or MDM system
- To identify resource consumption patterns and forecast resource demand.
- To spot and address utility network inefficiencies (e.g., water losses, energy waste) and enable alerting on critical events.
- To enable automated network load adjustment.
- To get insights for DSM programs.
- To identify cases of meter tampering fraud.
- To enable resource quality monitoring.
Asset management system
- To enable predictive and preventive asset maintenance.
- To enable data-driven assessment of asset ROI and financial performance.
Supply chain management system
- To enable inventory optimization.
- To optimize delivery routes.
Customer information system (CIS)
- To enable customer segmentation and personalize customer service.
- To understand customer sentiment towards the provided services.
- To ensure transparency across resource utilization and billing for customers.
What Can Enhance the Efficiency of Energy & Utilities Analytics
![]()
Visualization of network insights on maps
Having a map of the physical asset network and its real-time events helps plant managers, technicians, and engineers understand resource distribution patterns, promptly detect areas of outages, leaks, and other issues, and provide timely support to the affected sites.
![]()
Reports in regulatory-compliant formats
To save time and avoid errors, it is a good practice to implement report templates in the format required by regulators (e.g., FERC Form 1, EIA-860). Using the templates, the analytics solution can build such reports according to the established schedule or on demand and automatically send them to authorities.
![]()
Robust cybersecurity framework
To prevent data breaches and unauthorized access to SCADA and other internal systems, it is essential to implement robust access control management procedures, network security mechanisms (e.g., firewalls, intrusion detection systems), and encryption of data at rest and in transit.
Costs of Energy & Utilities Analytics Implementation
The costs of energy and utilities analytics implementation may vary from $100,000 to $1,000,000+. The investment size depends on each solution’s complexity, including its scale and integrations, the quality and nature of the data, the data processing speed (batch or real-time), and the need for ML/AI-powered capabilities.
Analytics for utilities and energy companies can bring a three-year ROI of up to 1600% with a 9-month payback period. The major ROI drivers are predictive maintenance and forecast-based demand planning capabilities, as well as higher customer satisfaction.
|
|
A basic solution |
A solution of medium complexity |
An advanced solution |
|---|---|---|---|
|
Data complexity
|
Structured data, e.g., CSV, XML, Parquet files. |
|
|
|
Data processing specifics
|
Batch processing (e.g., every hour, every 24 hours). |
Batch and real-time processing. |
Batch and real-time processing. |
|
Analytics complexity
|
Rule-based analytics. E.g., load demand forecasting based on historical demand data. |
Rule-based and ML/AI-powered analytics. E.g., load demand forecasting based on historical and real-time demand data. |
Rule-based and advanced ML/AI-powered analytics. E.g., AI-powered algorithms for smart thermostats to automatically adjust energy consumption based on real-time demand and pricing data. |
|
Reporting and visualization complexity
|
|
|
|
|
Costs
|
$100,000–$400,000 |
$400,000–$800,000 |
$800,000–$1,000,000+ |
82% of Energy & Utilities Companies Seek Advanced Analytics for Better Business Outcomes
Energy providers clearly understand that powerful analytics can drive better and faster decision-making, which can control costs, increase customer satisfaction, and provide a competitive advantage.
2023 ESG and Utility Dive Survey on Key Trends of Energy Providers
