Data Analytics in Insurance
Architecture, Features, Costs
ScienceSoft combines 37 years of experience in data analytics and AI with 14 years in insurance software development to design and implement reliable insurance analytics solutions.

Contributors

Principal Architect, AI & Data Management Expert, ScienceSoft

Senior Healthcare IT & AI Consultant, ScienceSoft
Insurance Data Analytics in a Nutshell
Insurance analytics is a set of tools and methods that enable automated aggregation and analysis of data on diverse insurance facets, including sales, underwriting, claim management, finance, customer behavior, and workforce.
With robust data analytics, insurers, intermediaries, and service providers get in-depth insights into the historical and projected performance of their business, which results in more accurate operational and strategic planning. AI-supported analytics solutions can provide intelligent guidance on the optimal insurance decisions to drive business profitability, minimize risks, and enhance customer experience.
Insurance fields that benefit from specialized analytics:
- Distribution and sales.
- Customer relationship management.
- Underwriting.
- Claim management.
- Financial management.
- Employee performance management.
Essential integrations: CRM, underwriting software, a policy administration system, claim management software, accounting software.
Implementation time: 9–15+ months for a custom insurance data analytics system.
Development costs: $100,000–$1,000,000+, depending on the solution’s complexity.
ROI: 300%+ for an intelligent insurance analytics system.
Sample Architecture of an Insurance Data Analytics System
If you’d like to get a general idea of how an insurance analytics system functions, first, here’s the high-level schema showcasing major system components and the purpose of each processing layer.
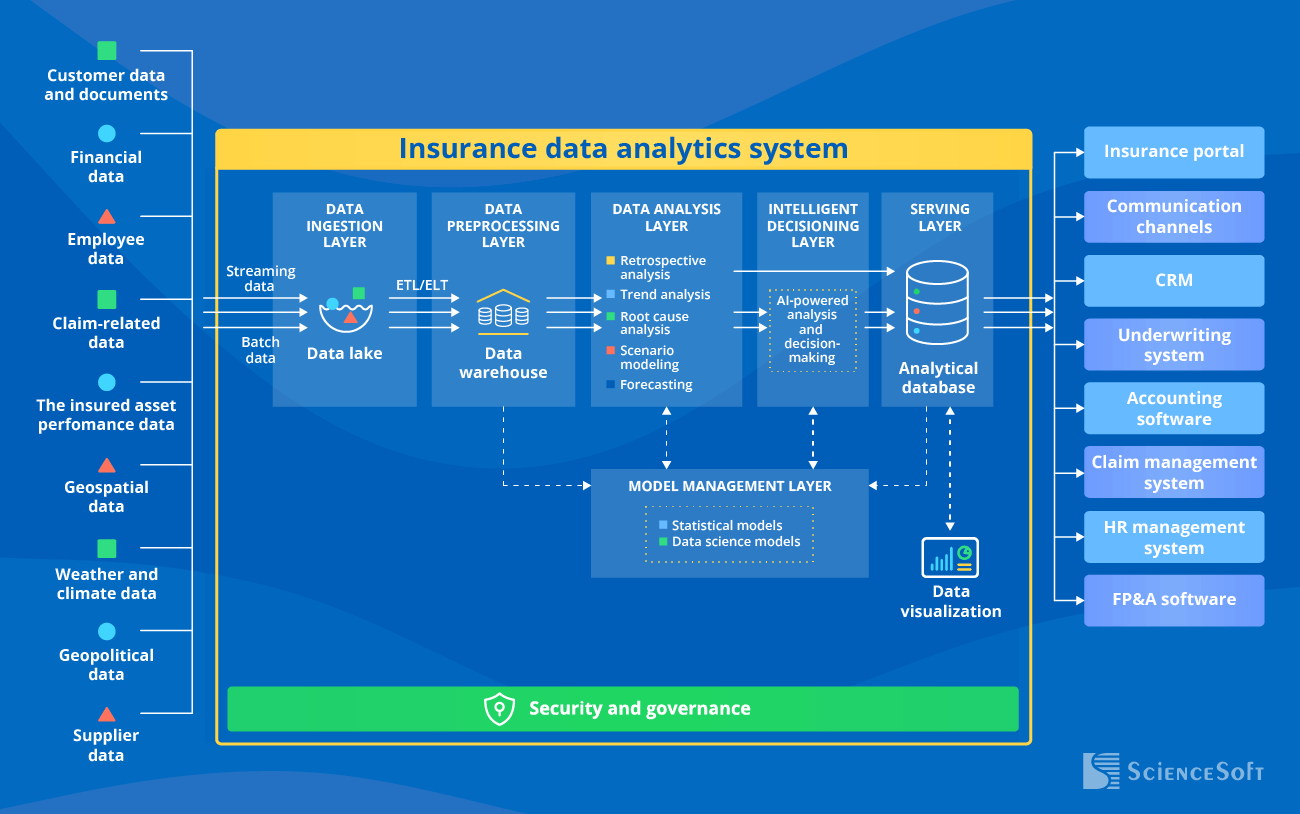
Data ingestion layer
enables the automated capture of multi-format insurance data from the integrated back-office systems (insurance software, financial software, HR management software, etc.) and third-party data sources (payment gateways, internal systems of damage handling service providers, local credit rating platforms, telematics, and more). This layer comprises a data lake that stores all the incoming data in its raw format.
Data preprocessing layer
automatically performs insurance data sorting, filtering, cleansing, and enrichment to improve data quality and integrity. Under the extract, transform, load (ETL) approach, the data gets preprocessed on a separate server and is then routed to a data warehouse (DWH) for storage. Under the extract, load, and transform (ELT) method, the data gets transformed within the data warehouse.
Data analysis layer
pulls the preprocessed data from the DWH and performs trend and root cause analysis, scenario modeling, event forecasting, and other analytics, depending on the system’s purpose. The obtained analytical results can be used as a trigger for automatic actions or can go directly to the serving layer to become available to system users.
Model management layer
serves to design, version, upgrade, and store diverse statistical and data science (including AI-based) models for insurance analytics.
Intelligent decisioning layer
relies on AI models to prescribe optimal insurance-related actions, e.g., charging a particular policy price or rejecting a fake claim.
Serving layer
stores the analytical results and visualizes them. It can instantly send the analytics insights to the insurance professionals, relevant corporate systems (e.g., CRM, underwriting system, claim management system, insurance portal, accounting software), and communication channels (mail services, auto-dialing systems, etc.).
Insurance Data Analytics Software: Key Features
In ScienceSoft’s data analytics projects, we create high-performing analytics solutions bound to each client’s specific needs. Below, we provide a comprehensive list of features that would form the core of a robust insurance analytics system.
![]()
Insurance data intake and processing
- Batch and real-time aggregation of insurance data.
- Support for multiple data formats: standard forms (ACORD, EDI, etc.), free-form digital text, images, video streams, IoT device readings, and more.
- Optical character recognition (OCR) for automated conversion of paper documents into a digital format.
- ML- and LLM-enabled capture and validation of data (e.g., customer information, risks, policy IDs, claim details) provided in digital insurance documents.
- Automated identification of missing, mismatched, or inaccurate insurance data.
- Auto-fixing (deduplicating, standardizing, etc.) erroneous records or routing them for a manual check.
![]()
Insurance data storage and management
- Centralized storage for raw and processed insurance data.
- Metadata storage and auto-population (e.g., to onboard customers faster, register insured assets, create and renew insurance policies).
- Automated data backup and recovery.
- Search engine with filtering and metadata querying to navigate insurance data and documents.
![]()
Descriptive insurance analytics
- Sales analytics: insurance sales by period, location, insurance type; average revenue per agent, new policies per agent.
- Customer analytics: new customers by period, retention and churn rate by customer segment, CLV.
- Underwriting analytics: customer risk score, average policy coverage amount, underwriting speed.
- Claim management analytics: claim volume by period, average settlement time, average cost per claim, claim frequency, claim severity.
- Finance analytics: total premiums by period, revenue per policyholder, the return on policyholder surplus, loss ratio.
- Workforce analytics: quote rate, bind rate, quotas vs. production, and more.
![]()
Diagnostic insurance analytics
- ML-based analysis of historical insurance data to spot:
- Dependencies between multi-dimensional events, e.g., between unemployment rates and claims related to property theft or between medical treatment outcomes and health insurance expenses.
- Major change drivers for particular insurance metrics.
- Patterns and anomalies in customer behavior and insurance KPIs.
- Identifying areas for improvement, e.g., suboptimal policy pricing, inadequate insurance agent workload, excessive loss reserves, etc.
- Monitoring digital employee activities and identifying non-compliant behaviors.
- Intelligent root cause analysis to understand the reasons behind events such as sudden insurance sales spikes, decrease in underwriter productivity, or systematic claims leakage.
![]()
- Scenario modeling and what-if analysis for various insurance process areas: risk management, pricing, claim reserving, etc.
- Intelligent forecasting of particular insurance metrics or events (e.g., loss cases, policy renewals, liquidity leakage) based on the analysis of:
- Historical data on policyholder behavior and the insured asset performance.
- Real-time lifestyle and behavior data in pay-as-you-live insurance.
- Weather and natural disaster forecasts.
- Traffic conditions.
- Insights on global and local disease outbreaks.
- Geopolitical situation.
- Expected changes in legal regulations.
![]()
Prescriptive insurance analytics
- Calculating optimal insurance prices.
- AI-powered decision-making on insurance claim approval or rejection.
- Automated task assignment based on employee availability and qualification.
- Determining the best-fitting service suppliers (e.g., healthcare providers, repair service providers) to handle claim-associated damage and injuries.
- Recommendations for policyholders to prevent claim events (e.g., to undergo medical checkups, perform asset maintenance, or change a fleet route to avoid a high-risk area).
- Planning the optimal claim expense budget.
![]()
Insurance data visualization
- Business intelligence dashboards for sales agents, underwriting specialists, claim managers, financial analysts, etc.
- Configurable insurance data visualization formats, including:
- Interactive pivot tables for customer data representation.
- Heat maps for risk communication.
- Symbol maps to reflect historical and projected insurance metrics by location.
- Customizable templates for insurance sales reports, loss run reports, financial statements, etc.
- Reports compliant with jurisdiction-specific standards: IFRS 17 and NAIC for the US, Solvency II for the EU, IA for the KSA, etc.
- Scheduled and ad hoc report generation and automated distribution (internally and to the relevant legal regulators).
![]()
Insurance data security
- Full audit trail of manipulations with insurance data.
- Permission-based access control.
- AI-powered detection of fraudulent insurance transactions.
- Data encryption in transit and at rest.
- Data processing, governance, and storage in compliance with NAIC regulations (incl. AI Model Bulletin), KYC/AML requirements, GLBA, NYDFS, CCPA, IA regulations (for the KSA), GDPR (for the EU), HIPAA (for health insurance), state-level AI regulations (e.g., Colorado AI rules), NIST AI RMF, model risk management best practices (e.g., SR 11-7), and more.
- (optional) Insurance data hashing, timestamping, and recording in an immutable blockchain ledger.
Power Your Insurance Processes by Modern Data Analytics
ScienceSoft’s team is ready to design and build a robust analytics solution to help you get a 360-degree view of your insurance operations and ensure accurate decision-making.
Steps to Implement Insurance Analytics
Below, ScienceSoft’s consultants describe the key steps needed to implement an effective insurance data analytics solution:
1.
Requirements engineering

This step aims to shed light on your insurance analytics needs and define functional and non-functional requirements for the future solution. Interviewing employees from various domains (customer relationship, underwriting, claim processing, etc.) and investigating current insurance data flows helps understand field-specific analytical needs. By auditing the data management infrastructure and available analytical tools, you can also assess infrastructure readiness for analytics implementation.
At ScienceSoft, this step also includes eliciting regulatory compliance requirements to design analytics software in accordance with the latest sectoral standards and regulations.
2.
Technical design

At the software design stage, the software architect would need to answer the following questions:
- What insurance analytics components do you need to implement (data lake, ETL/ELT pipelines, DWH, etc.)?
- What specific functions should your solution cover: customer risk assessment, claim processing and fraud detection, BI dashboards for different departments, etc.?
- What analytical models do you want to leverage: statistical, data science (non-NN or deep learning)?
- What architectural approach (monolith, modular, serverless) works best for your needs?
- What other systems (e.g., CRM, corporate finance management) the analytics system needs to be integrated with?
- What technologies and tools are the most suitable for the development of the analytics system?
We suggest modular SOA and microservices architectures if you need scalability to process growing data volumes or plan to evolve your analytics software over time. There are also analytics techniques that are best suited for particular processes, e.g., regression analysis for insurance risk modeling and pattern matching to spot fraudulent claims.
When composing an insurance analytics tech stack, we prioritize proven open-source development tools and go with ready-made logic and UI components where possible. This helps us deliver analytics faster and with less effort, which results in optimized project costs.


3.
UX and UI design

To streamline user adoption and shorten the learning curve, it’s best to provide specialized interfaces and tools for various roles (e.g., analysts, underwriters, loss adjusters, senior management). ScienceSoft’s UX/UI designers often study the existing analytics software used by our clients’ teams to provide familiar workflows and tools for them to easily navigate the new solution.
4.
Development and QA

This is the step where developers carry out the coding and set up data storage. Depending on the system design, developers may use pre-built components, but to adapt them to your insurance analytics flows, they will need to create a significant share of custom code.
ScienceSoft usually conducts rigorous testing in parallel with coding to fix any possible defects before the software goes to production.
If you want AI-powered insurance analytics, this stage may also cover design and training of machine learning models for forecasting and optimization, or integration of large language models for reasoning and intelligent suggestions. Our data scientists can help create explainable models with clear, easy-to-interpret logic to ensure transparent and compliant AI-supported decisions.

5.
Integrations

By establishing integrations between your analytics solution, proprietary and third-party data sources, and corporate systems, you eliminate the need for manual data transfer and replication, which removes human errors and leads to increased speed and accuracy of insurance operations. ScienceSoft’s QA engineers recommend ending this step with integration testing to ensure smooth and safe connections between the systems.
6.
Deployment and knowledge transfer

Once the data management infrastructure is configured and robust network security mechanisms are in place, you can set the analytics system live. At this stage, ScienceSoft’s team draws up user guide materials and delivers comprehensive technical documentation to streamline system maintenance. We can also conduct full-scale training to help your insurance teams quickly master the new tool.
Costs of Insurance Data Analytics Software
Developing a custom insurance data analytics system may cost around $100,000–$1,000,000+, depending on the scope of the solution’s capabilities, data volume and complexity, the number of integrations, and security and compliance requirements.
Below, we share the approximate cost estimations based on ScienceSoft's experience in data analytics projects:
![]()
$100,000–$250,000
Building a basic data analytics solution that:
- Calculates KPIs across 1–2 insurance analytics areas, e.g., underwriting and policy issuance.
- Integrates with 1–2 key data sources.
- Offers batch data processing (e.g., every 12 hours).
- Features pre-built customizable insurance report templates.
![]()
$250,000–$400,000
Developing data analytics and BI software that:
- Calculates KPIs across multiple insurance areas: operations, finance, employees, etc.
- Integrates with 3–7 corporate and external systems.
- Enables batch and real-time data processing.
- Enables diagnostic and predictive insurance analytics using non-neural-network ML models.
- Provides a no-code template builder to create custom report forms from scratch.
![]()
$400,000–$1,000,000+
Building a comprehensive analytics system that:
- Covers the entire scope of business metrics, including insurance market performance, competitor benchmarks, and case-specific variables, e.g., projected damage severity for parametric insurance.
- Integrates with multiple back-office and third-party systems, including IoT and blockchain solutions.
- Features real-time big data analytics for instant KPI calculation and insurance event monitoring.
- Provides root cause analysis and forecasting using deep learning models.
- Offers AI-supported prescriptive insurance analytics.
- Provides rich data visualization capabilities and automated generation of complex reports.
Learn the Cost of Your Insurance Analytics Solution
ScienceSoft is ready to provide a free cost estimate for your specific case.
Major Financial Outcomes of Implementing Data Analytics in Insurance
|
|
|
|
|
|
|
NB! With AI, you can automate the vast majority of insurance analytics processes and use self-learning predictive and prescriptive models that adapt to the changes in your data. According to Accenture, an intelligent data analytics system can bring an ROI of 300% to 900%. |
|
|
|
|
|
|
|
|
When to Opt for a Custom Solution
ScienceSoft’s experts recommend developing a custom insurance data analytics system in the following cases:
- You need to build non-standard formulas and complex analytical models to calculate and forecast KPIs across specific insurance types, such as parametric insurance, kidnap and ransom insurance, or mortgage insurance.
- You need a solution that can seamlessly analyze insurance data in diverse formats, including handwritten text, voice recordings, and sensor data.
- You want AI-supported guidance on optimal policy prices, claim approval or rejection, employee task assignment, and other insurance-related decisions.
- You want to integrate your insurance data analytics solution with all required software, including legacy corporate tools.
- You need advanced security of insurance data and compliance with numerous local insurance regulations.
- You have large insurance teams involved in data analysis processes and want to avoid the sizable subscription fees for market-available analytics tools.
Insurance Data Analytics Engineering Services by ScienceSoft

Insurance data analytics consulting
We can design the optimal functionality, architecture, UX and UI, and tech stack for your data analytics solution. You receive a detailed project roadmap for smooth implementation and get expert advice on project cost optimization opportunities.

Insurance data analytics implementation
We can fully develop your analytics system and integrate it with any required software. Our data scientists design, train, and tune ML-based analytics models to ensure maximal accuracy of analytical results. You benefit from a quick project start (1–2 weeks) and a fast solution launch.
Why Implement Insurance Data Analytics With ScienceSoft
-
Since 2012 in engineering custom software solutions for the insurance industry.
-
Since 1989 in full-cycle data analytics and AI services.
- Insurance IT and compliance consultants (NAIC, NYDFS, CCPA, GDPR, etc.) with 5–20 years of experience.
- 45+ certified project managers (PMP, PSM I, PSPO I, ICP-APM) who succeeded in large-scale projects for Fortune 500 firms.
- Principal architects with hands-on experience in designing complex insurance automation systems and driving secure implementation of emerging technologies.
- 350+ software engineers, 50% of whom are seniors or leads.
- Established practices to ensure the high quality of insurance solutions and their delivery on the agreed timelines and budget, despite project constraints or uncertain requirements.


Our Clients Say
Partnering with ScienceSoft for our software maintenance and evolution initiative has been an excellent experience. They identified and fixed several longstanding issues that had been causing us persistent difficulties. Special mention goes to the redesign of our reporting module, which increased reporting speed by 30 times.
Ted Frost, Managing Director at Frost Insurances
![]()
Insights From ScienceSoft's Insurance IT Experts

Vital Soupel
Senior Insurance IT & AI Consultant, ScienceSoft
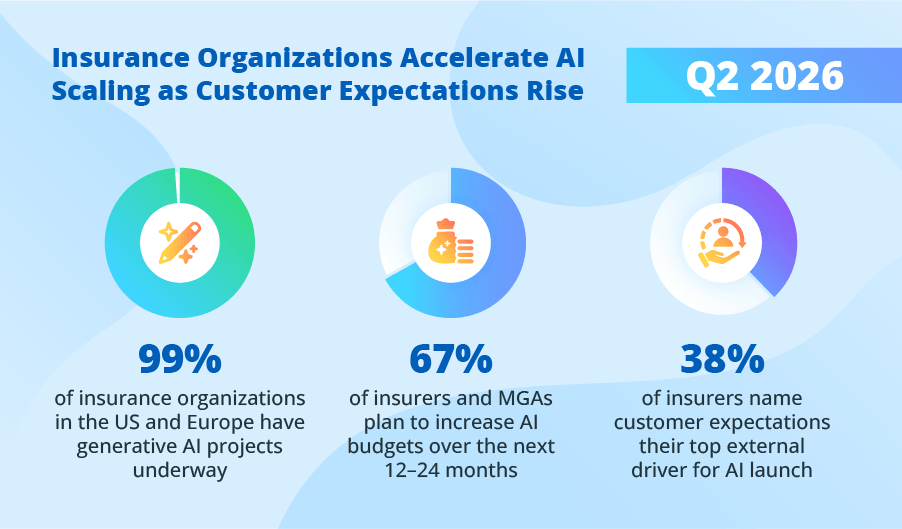
Trend watch
Q2 2026 Insurance AI Trends by ScienceSoft | July 2026

Olga Vinichuk
Insurance IT & AI Consultant and Lead Business Analyst, ScienceSoft
Interview
How to Cut Health Insurance Operating Costs

Stacy Dubovik
Financial Technology & AI Researcher, ScienceSoft

Interview
Using AI for Financial Planning in Health Insurance
About ScienceSoft
ScienceSoft is a global IT consulting and software development company headquartered in McKinney, Texas. We implement business intelligence in insurance and deliver custom data analytics solutions powered by AI technology. Being ISO 9001- and ISO 27001-certified, we apply a mature quality management system and guarantee the full security of our clients’ data.
