Analytics in the Media and Entertainment Industry
A Full Overview
In data analytics and AI since 1989, ScienceSoft builds custom analytics solutions for both print and digital M&E companies to let them get a 360-degree view of their audience and personalize its experience, optimize financial, marketing, and production management, and more.

Contributors

Principal Architect, AI & Data Management Expert, ScienceSoft

Senior Healthcare IT & AI Consultant, ScienceSoft
Data analytics in media and entertainment is a way to consolidate data on audience, content, financial management, marketing campaigns, and HR processes and get data-driven insights, including real-time content performance indicators, patterns in audience behavior, and content popularity forecasts. Advanced analytics features allow businesses to benefit from ML/AI-powered recommendation engines, NLP-driven customer sentiment analysis, financial modeling, and more.
- Development time: from 2—6 months for an MVP.
- Core integrations: ERP, CRM.
- Costs: from $50,000—$1,000,000+, depending on the solution’s complexity. Use our online calculator to get a tailored cost estimate.
- ROI: up to 220%
Analytics Capabilities to Benefit M&E Companies
Below, you can explore some of the most common features of analytics in the media and entertainment industry. All the insights driven by an analytics solution are represented in interactive dashboards with intuitive visuals and custom capabilities for slicing and dicing, drilling up and down, scheduled and ad hoc reporting.
![]()
Customer and marketing analytics
- Multidimensional audience segmentation (e.g., by demographics, preferred content, engagement level, used device).
- Optimized targeting by identifying trends and patterns in content consumption, including segment-specific content preferences, viewing habits, and seasonal trends.
- Customer lifetime value analysis.
- Monitoring the performance of marketing campaigns, e.g., click-through rates, ad revenue, conversions.
- Predictive analytics to forecast and prevent customer churn.
- Real-time personalized content recommendations powered by big data and ML/AI engines.
![]()
Content performance analytics
- Analyzing content performance, e.g., media coverage, sales volume, the number of views, streams, clicks, and shares, watch time, completion rates.
- Benchmarking content performance against competitors.
- NLP-powered audience sentiment analysis based on data from social media and reviews, e.g., to identify popular topics for new content creation.
- Forecasting the performance of potential content based on historical data and current market trends.
- What-if modeling, e.g., to simulate the results of content localization.
![]()
- Automated monitoring and segmentation of the required KPIs, e.g., cost per subscriber, profitability per book volume or series episode, cash flow by sales channel.
- Attributing revenue to generation streams, e.g., advertising sales, subscription fees.
- Multidimensional costs analytics, including expenses for content production, marketing, and distribution.
- Profitability analysis with ROI and profit margin calculation.
- Reports on the financial performance of licensed content and profit-sharing agreements.
- Financial modeling and forecasting, e.g., for budgeting, financial risks mitigation.
![]()
- Content production analytics with insights into scheduling, resource allocation, cycle time, and budget distribution.
- GenAI capabilities to create and optimize content.
- Analyzing employee performance, including productivity, turnover, and performance vs. compensation analysis.
- Insights into employee training processes and outcomes with skill gaps identification and employee-specific training recommendations.
- Detecting illegally copied and distributed content and providing instant alerts.
- Continuous monitoring of data access, sharing, and usage and alerting on non-compliance with personal customer data protection regulations like GDPR and CCPA.
Core Integrations for an Analytics Solution in M&E
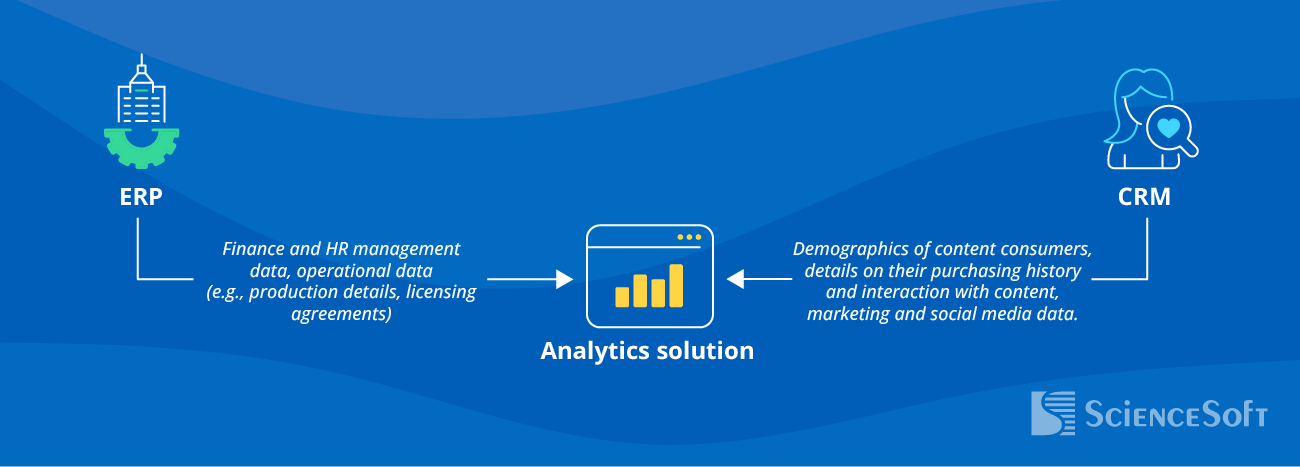
ERP
- To get insights into revenue generation and support data-driven budgeting.
- To analyze employees’ performance and satisfaction, reduce turnover, and promote top talents.
- To optimize and accurately plan the production process.
CRM
- To get insights into content performance.
- To provide personalized content recommendations.
- To identify patterns in audience interaction with content.
- To understand audience sentiment toward the existing content and identify trends for new content ideas.
High-Level Overview of Development Steps for Analytics Software in M&E
Development of analytics software for media and entertainment is the process that prioritizes the creation of tailored analytics features, TCO optimization, user-specific UX/UI design, and other processes that would allow the delivered solution to help M&E companies reach their unique goals.
1.
Business analysis

At this stage, business analysts conduct interviews with the stakeholders to understand their business needs and goals and translate them into actionable software requirements. E.g., if a company wants a recommendation engine, business analysts would likely document low-latency processing as one of the priorities for the solution-to-be.
During this step, ScienceSoft also elicits the requirements for regulatory compliance to build the system in line with personal data protection laws like GDPR, CCPA, and more.
2.
Architecture design

Software architects design solution components (e.g., data lakes, ETL/ELT pipelines, a DWH) with a focus on solution security and scalability. E.g., they can plan for automated resource adjustment in response to varying workloads (think of an increase in the activity of content consumers during peak periods like major broadcasting events or new content releases and the need for more processing power to analyze interaction data).
Being technology agnostic, ScienceSoft compares the offerings of multiple technology providers to choose those technologies that ensure the best cost-to-performance ratio and TCO optimization.
3.
UX/UI design

Designers work in collaboration with developers to efficiently map user journeys. To facilitate user adoption, they also audit the software the company has in use to implement similar workflows where possible.
According to our best UX/UI design practices, we tailor dashboard functionality to the specifics of user roles. E.g., we implement filtering, drilling, and slicing capabilities for financial teams to easily identify trends and root causes, while C-levels get static interfaces that provide a general overview of company health and dynamics.
4.
Development, QA, and deployment

Developers code the solution, while QA engineers perform in-parallel testing to fix possible inefficiencies. In case the analytics solution features ML/AI-powered capabilities (e.g., for financial forecasting, content success prediction, consumer sentiment analysis), this step also includes building and training ML models or customizing and integrating public-available ones.
ScienceSoft always tries to find ways to optimize development costs. Depending on the case, we can reuse proven third-party components and microservices, design CI/CD pipelines, and go for feasible QA automation. Such an approach helps us decrease development costs by up to 78%.
Costs & ROI
The costs of media and entertainment analytics software development can range from $50,000 to $1,000,000+ depending on the solution’s scope. The major cost factors include the number of business areas to be covered (e.g., financial management, marketing), data types (e.g., structured or unstructured), and the complexity of analytics features (e.g., rule-based or ML/AI-powered insights, scheduled or real-time analytics output, the need for big data technologies).
Analytics in media and entertainment can bring an ROI of up to 220% due to the capabilities for informed content creation, accurate personalized content recommendations, financial planning, and more.
![]()
$50,000—$80,000
Solution with basic features:
- Scheduled analytics insights, e.g., calculating marketing campaign or financial performance KPIs every 2 hours, every 12 hours, every week.
- Processing of structured data, e.g., CSV. XML, Parquet files.
- Rule-based analytics, e.g., revenue attribution by source.
![]()
$80,000—$400,000
Solution with features of medium complexity:
- Scheduled and real-time insights, e.g., alerts on deviations in the production budget.
- Processing structured and unstructured data of low velocity, e.g., consumer reviews, social media posts and comments.
- Basic ML/AI-powered capabilities, e.g., forecasting content popularity based on historical data.
![]()
$400,000—$1,000,000+
Solution with advanced features:
- Batch and real-time big data analytics, e.g., for pirate activity detection, instant content recommendations.
- Processing structured and unstructured data of high velocity, e.g., real-time data on audience interaction with content.
- ML/AI-powered capabilities, e.g., forecasting content popularity based on historical data and real-time market trends; multi-factor what-if scenarios for financial planning.
Your Case is Unique – Get a Custom Estimate for It!
Please tick answers to our questions about your data analytics needs (it takes ~ 5 minutes), and our experts will calculate a custom quote for you.
87% of Companies Report Measurable Business Value from Their Data Analytics Investments
|
|
|
|
|
The figure is featured in the 2024 Data And AI Leadership Executive Survey by Wavestone. The report contains feedback from 100+ global industry leaders that use analytics in their daily operations. The study participants include such M&E companies as Bloomberg, Creative Artists Agency, Facebook/Meta, Financial Times, Universal Music Group, and NFL. |
|
|
|

