Financial Data Analytics
Software Features, Costs, and ROI
In data analytics and AI since 1989, ScienceSoft engineers custom analytics systems that help organizations get a 360-degree view of their financial performance and enable precise forecasting, informed risk management, and strategic budgeting.

Financial Data Analytics: the Essence
Financial analytics is the process of driving actionable insights from diverse financial data sources, such as sales, cash flow, and revenue, to refine business strategies and optimize decision-making processes. Custom financial analytics solutions enable companies to gain real-time insight into budget management, leverage machine learning for precise financial forecasting and process optimization, and build what-if scenarios for financial planning and risk mitigation.
- Implementation time: from 2–6 months.
- Implementation costs: $20,000–$600,000, depending on solution complexity and business scope. Use our free online calculator to get a ballpark estimate for your case.
- Integrations: ERP, accounting software, treasury software, pricing software, CRM.
- ROI: up to 120% with a payback period of 9 months.
Financial Analytics: Key Features
Below, ScienceSoft's experts list the financial analytics capabilities most requested by our clients.
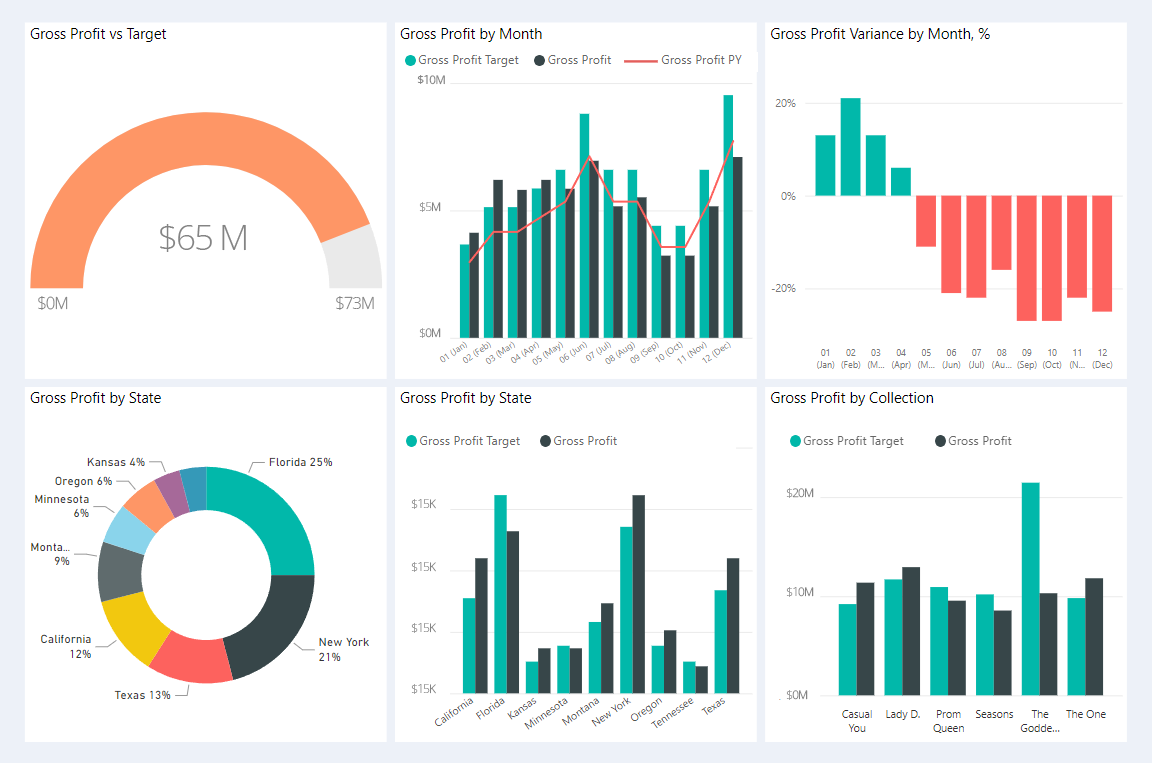
![]()
Financial performance analytics
- Financial KPI monitoring (e.g., ROA, FCF, net profit margin).
- Multi-dimensional financial performance analytics (e.g., sales per period, product line, and location).
- Performance benchmarking against industry standards and competitors.
- ML-powered trends identification and root cause analysis (e.g., for budget variance control).
- Scenario modeling and what-if analysis.
- Financial performance forecasting based on historical data or intelligent AI predictions.
- AI-based prescriptions on the optimal financial decisions across budgeting, payment planning, etc.
![]()
Cash flow analytics
- Tracking cash flow KPIs, e.g., operating cash flow (OCF), working capital ratio, free cash flow to equity (FCFE).
- Real-time cash inflow and outflow monitoring.
- Automated segmentation of cash flow by activity (operating, investing, financing) and cash transaction (e.g., AR, taxes).
- Identification of the most profitable cash inflow sources.
- AI-powered cash flow forecasting with what-if scenarios.
![]()
Accounts payable analytics
- Tracking AP metrics (e.g., DPO, amounts paid and owed, AP turnover ratio).
- AI-supported identification of early payment opportunities and possible savings calculation.
- Identification of AP process bottlenecks and their root causes.
- AI-powered identification of an optimal exchange rate.
![]()
Accounts receivable analytics
- Automated calculation of AR metrics (e.g., DSO, AR turnover ratio) and paid, partially paid, and overdue amounts.
- AR trends identification (e.g., late-to-pay customers and customer groups).
- Smart recommendations on collection process optimization strategies.
- Revenue variance analysis.
- Revenue recognition compliance analytics.
![]()
- Real-time investment transactions monitoring.
- Continuous investment performance tracking (e.g., ROI, NVP, profit margin) and benchmarking.
- AI-powered investment performance forecasting with what-if scenarios.
- Intelligent suggestions on the optimal investment decisions.
- Investment compliance monitoring against regulatory requirements and internal policies.
![]()
Financial risks analytics
- Continuous monitoring of liquidity, credit, and investment risks with relevant metrics calculation (e.g., current liquidity ratio, debt-to-equity ratio, investment volatility).
- Suggestions on the exposure limits to liquidity, credit, and market risks.
- Continuous analytics of financial markets and economic trends (e.g., FX rates, commodity prices) and their possible influence on financial performance.
- Profitability forecasting.
- What-if simulations to measure asset performance under various conditions.
![]()
Tax analytics
- Automatic analysis of tax amounts across various tax types (e.g., VAT, sales, withholding, income tax).
- Identifying tax management inefficiencies (e.g., paying sales tax on exempt items, missed opportunities for tax credit or deduction).
- Predictive analytics for future tax liabilities based on historical tax data analysis.
- AI-powered recommendations on tax-related savings, e.g., pinpointing suppliers with the best import tariffs or identifying opportunities for tax credits.
![]()
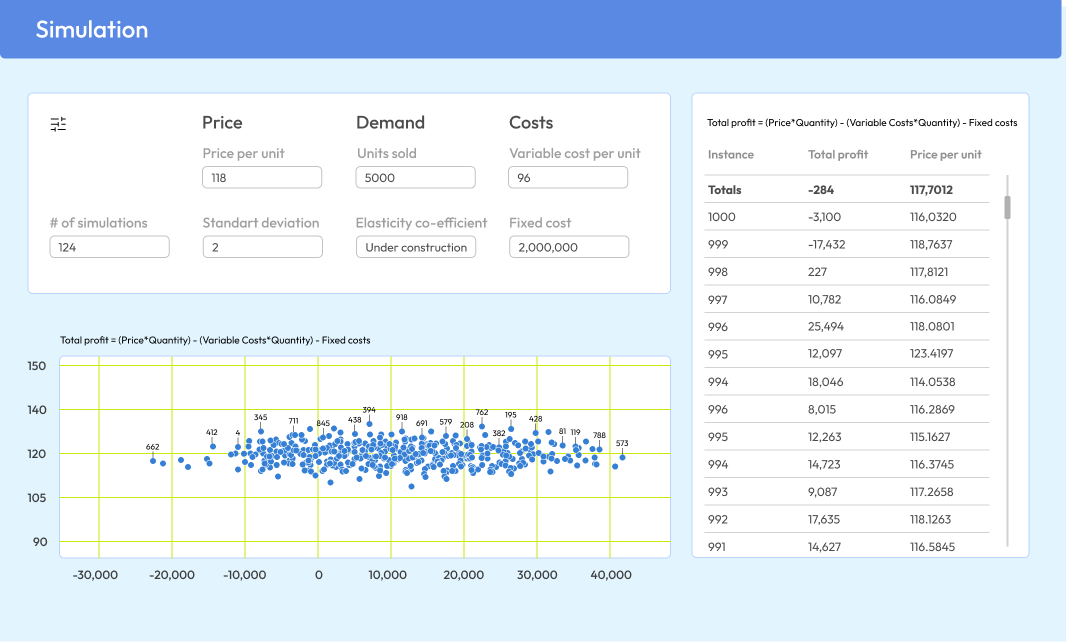
Pricing analytics
- Pricing strategy planning through customer demand and sales margin analytics, competitor prices and stock availability analysis, and pricing scenario modeling.
- Automated initial price calculation in line with the defined pricing strategy.
- Analytics-based suggestions on pricing strategies specific to certain customer segments.
- Identifying the dependence between certain pricing strategies and product/service profitability.
- AI-powered promotional pricing recommendations, e.g., optimal discount amounts.
- AI-supported dynamic pricing management.
![]()
Payroll analytics
- Detailed employee compensation analysis (e.g., salary, bonuses, commission) vs. demonstrated performance.
- Payroll benchmarking against the current industry situation.
- Continuous payroll process monitoring and non-compliance alerting (e.g., failing to pay overtime wages).
- Labor cost forecasting based on historical data and market trends analysis.
![]()
Financial fraud analytics
- Continuous monitoring and detection of potentially fraudulent activities (e.g., real-time anomaly detection in transaction patterns, identifying irregularities in financial statements, logging unauthorized access attempts).
- Immediate alerts on suspicious activity.
- Behavioral analytics to understand and flag unusual user activities.
- Integration with threat intelligence databases to identify emerging fraud patterns.
- Customizable rule-based detection to adapt to specific fraud scenarios.
![]()
Data processing and storage
- Automated ingestion of financial data (e.g., financial statements, sales performance, market trends) from integrated enterprise and third-party sources.
- ETL/ELT-powered data aggregation, cleansing, and consolidation in a data warehouse.
- Batch and real-time financial data processing.
- Secure data storage, transfer, and access mechanisms compliant with regulatory requirements (e.g., HIPAA, GDPR, GAAP, SEC, SOX, IFRS, ASC 606, CMA).
![]()
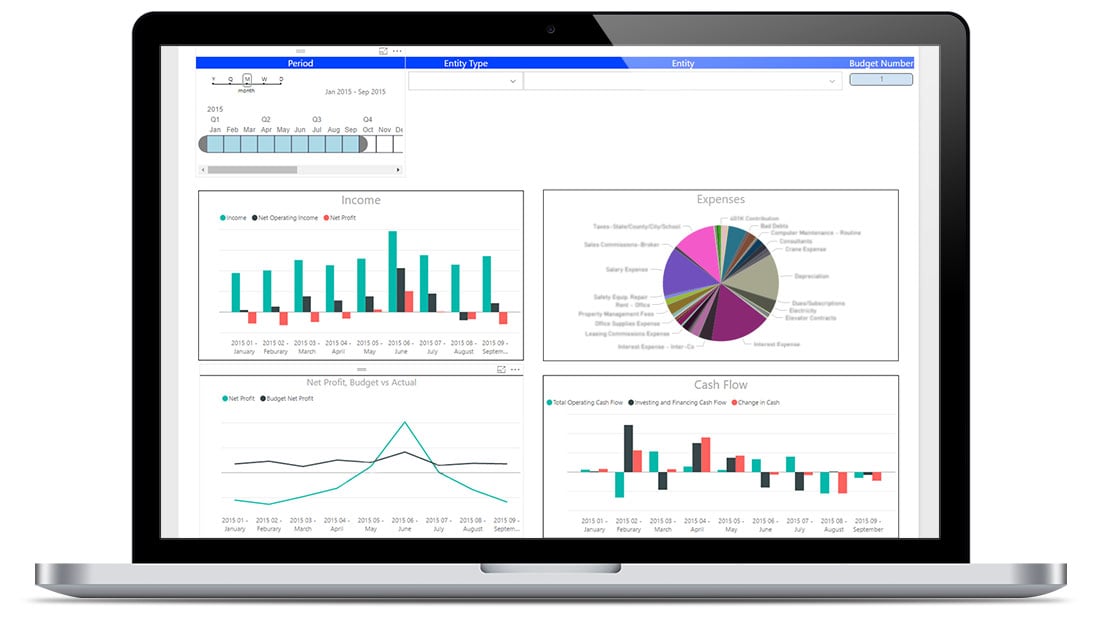
Financial reporting
- Generating financial reports that fit industry-specific forms, e.g., IFRS17, Basel III, Metro 2, 1099-MISC.
- Creation of scheduled and ad hoc reports with automated submission to the relevant parties.
- Clear data visualization in user-friendly, dynamic dashboards with capabilities for drilling up and down, slicing, and dicing.
- UI adapted to the needs of different user groups (e.g., accountants, financial analysts, executives).
Essential Integrations for a Financial Analytics Solution
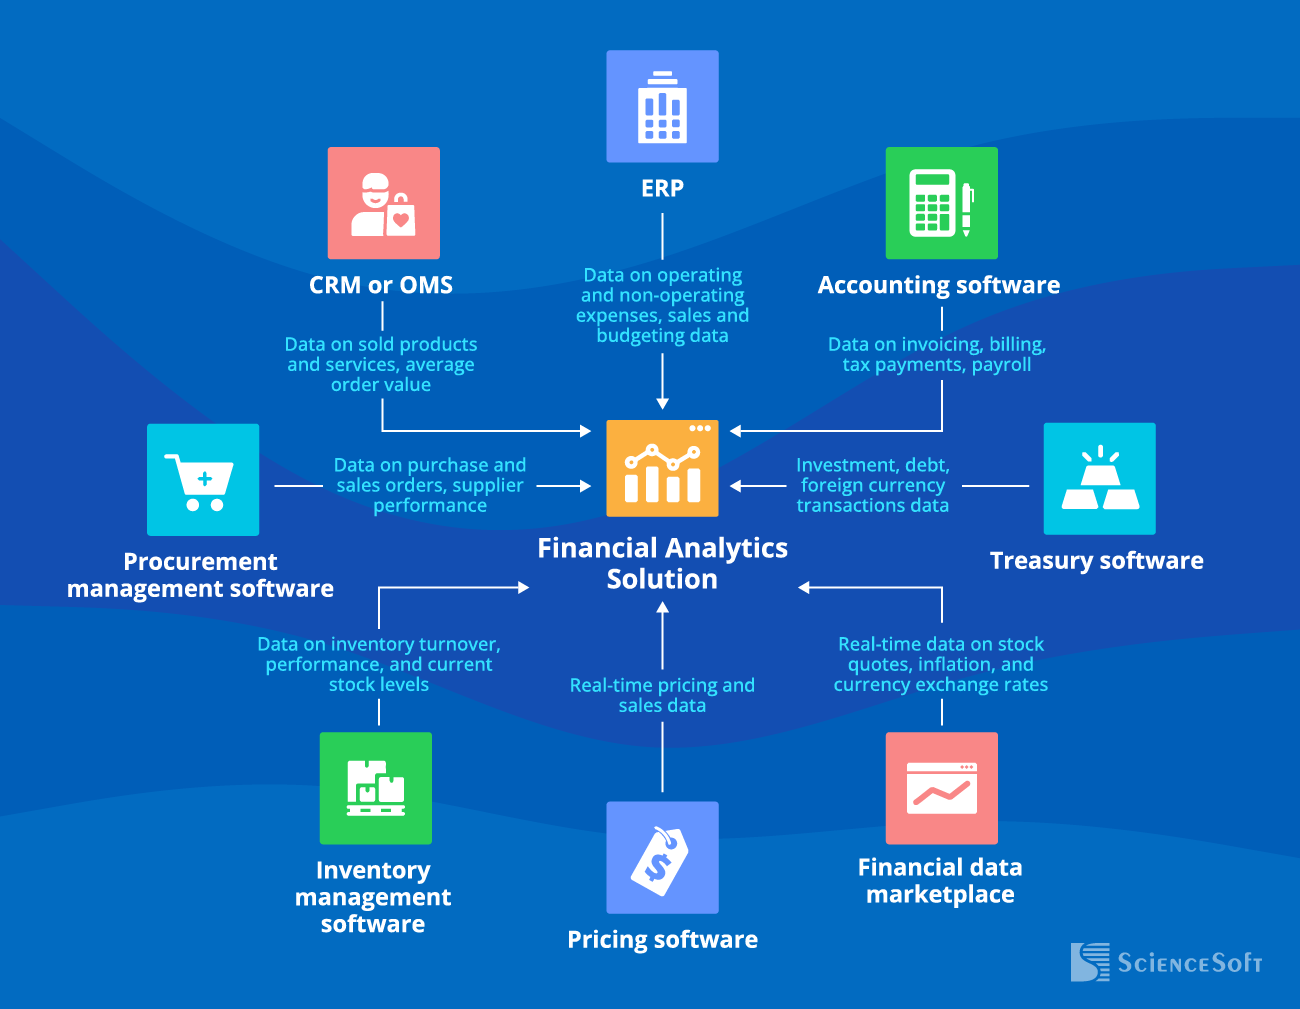
- To gain enterprise-wide visibility into financial performance and make informed decisions on its improvement.
- To accurately plan accounting procedures.
- To streamline compliance with tax and labor law regulations.
- To analyze investment performance and optimize investment management.
- To timely identify and mitigate financial risks.
Financial data marketplace
- To get an up-to-date view of financial markets and use this data for accurate financial modeling and forecasting.
- To enable historical and real-time analytics of prices and get pricing optimization suggestions.
CRM or OMS
- To analyze revenue and determine revenue-generating customer segments.
- To align the company's sales and marketing strategy with the financial plans.
- To identify cost optimization opportunities in inventory management.
- To forecast inventory-related costs.
- To assess the financial efficiency of suppliers.
- To enable informed procurement cost planning.
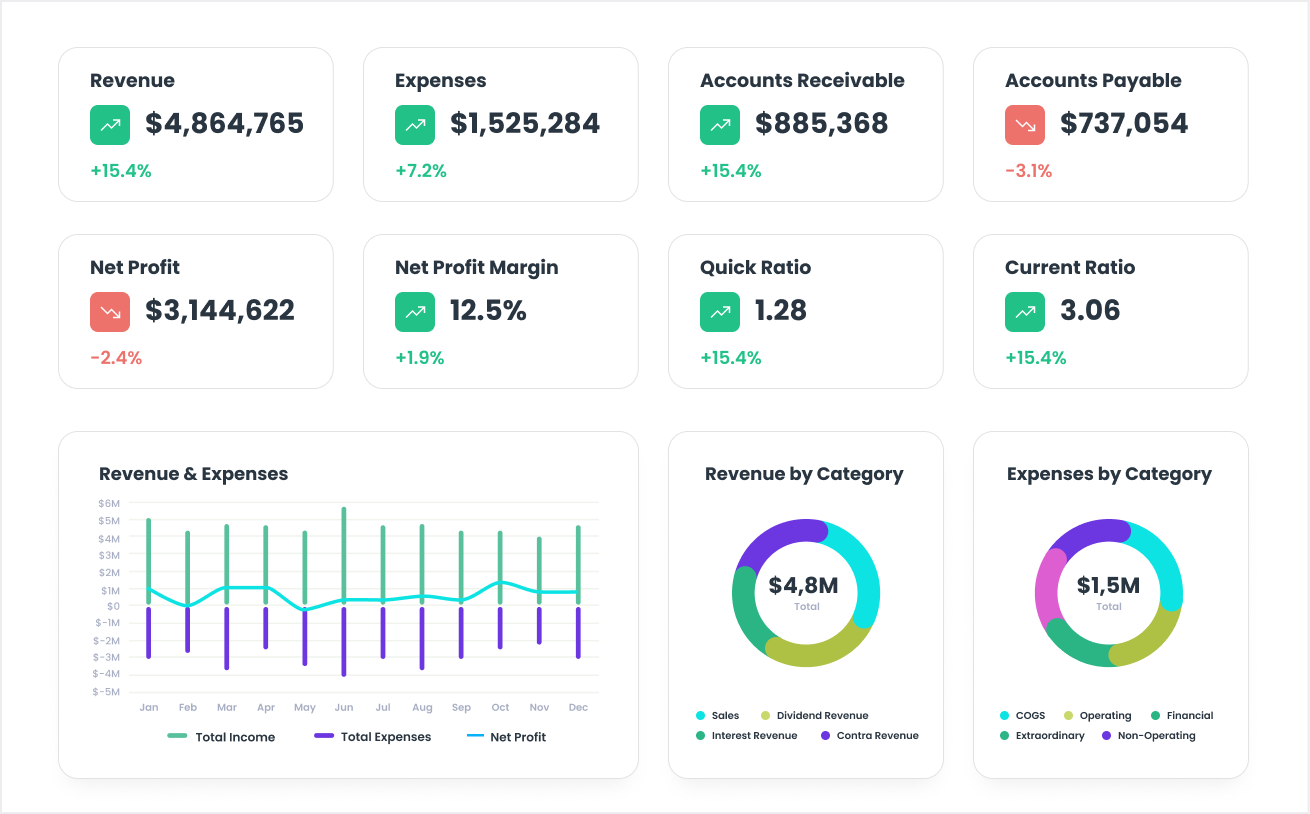
See What Insights You Can Get With Financial Analytics
4 Steps to Building a Successful Financial Analytics System

Ensure smooth user adoption
Instead of rolling out a completely new and unfamiliar interface, build dashboards that are an optimal blend of old and new capabilities. E.g., implement cross tabs that display numerical data as both tables and charts. This way, the UI will be close to the familiar spreadsheet-like tools and help your conservative users gradually explore new features.
Enable compliant reporting on the system level
To avoid manual data preparation for financial reporting, ensure your analytics system complies with the required standards, such as GAAP, SEC, SOX, IFRS, ASC 606, and CMA. Make the layout of your financial reports fit the format of industry-specific forms (e.g., IFRS17 for insurance, Basel III for banking, Metro 2 for lending, 1099-MISC for healthcare). This way, the software output will be immediately ready for submission to authorities.
Customize the system to your industry
OOTB financial software is a good stepping stone for small businesses, but the larger your company becomes, the more complex and industry-specific its financial processes will be. Rather than being limited to basic analytics dashboards, manufacturers would benefit from insights into warranty policies and their impact on financial performance, while healthcare providers need insurance claims analysis to get a comprehensive view of their revenue.
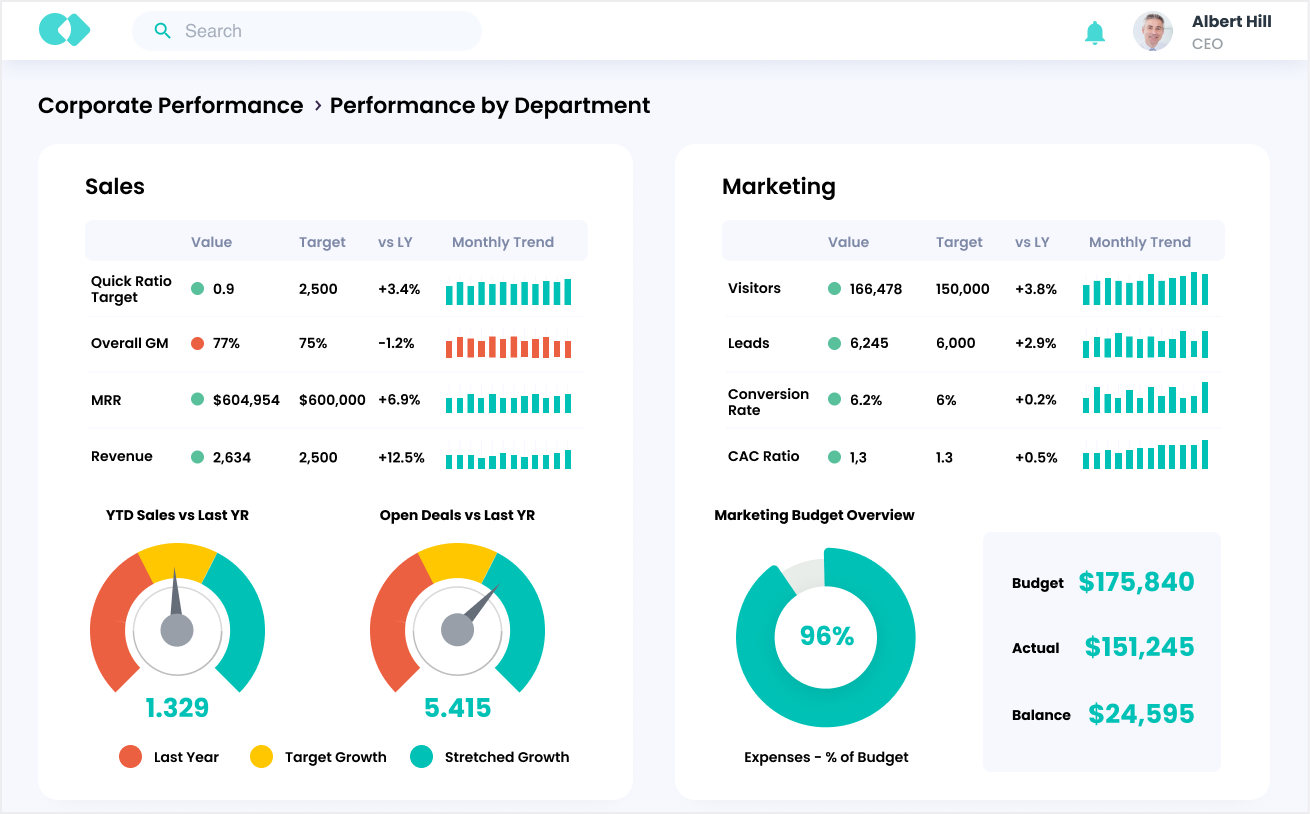
Build role-specific dashboards
Tailor the dashboards’ UI to the types of insights required by different roles. For example, financial analysts need access to granular data views and ad hoc queries, but managers want to see their departments’ financial statistics and receive immediate alerts on important events (e.g., budget overruns). Finally, the C-suite would appreciate enterprise-wide financial performance dashboards that provide a bird’s eye view of the organization’s financial health.
Explore ScienceSoft's Featured Financial Data Analytics Projects
Financial Analytics Implementation for a Real Estate Company
- Aggregating data from 40 disparate sources.
- Providing insights into cash flow, operating expenses, net profit, and more.
- Implementing granular filtering capabilities (e.g., by branch, account, date).
Result: 17 reports and 5 dynamic dashboards reflecting company-wide financial performance.

Data Analytics Solution for Sales Analysis across 10,500 Stores
- Accumulating and analyzing sales data on 100+ SKUs from 10 large retail chains.
- Automated sales KPIs calculation (e.g., sales per store and per certain period).
Result: optimization of sales and marketing strategies thanks to easy-to-spot sales trends.

Business and Financial Analytics for Management Consultancy
- Automated data analytics across 40 dimensions.
- Drill-down and drill-through capabilities with 12 filters.
- Analytics for gross profit, revenue, net income, NWC, and more.
Result: in-depth analytics of financial performance in various economic conditions.
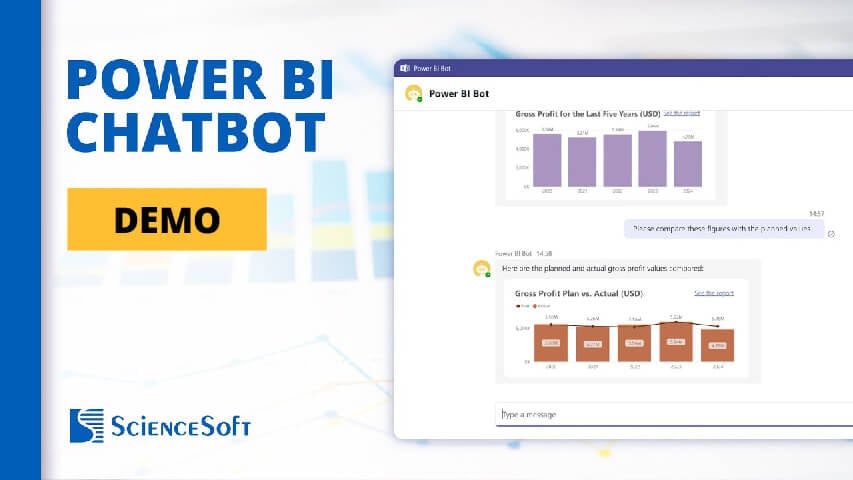
Financial Analytics Simplified With a Power BI Chatbot
See how a Power BI chatbot provides users with financial analytics metrics based on natural language commands. The chatbot is trained on the company’s data and enables navigation to the relevant Power BI reports.
Costs and ROI of Financial Analytics Implementation
The cost of implementing a financial analytics solution may vary from $20,000 to $600,000, depending on software complexity. Major cost factors include the scope of integrations, data volume and diversity, the need for value-adding technology (AI/ML, big data), and solution performance requirements.
On average, financial analytics solutions bring an ROI of about 120% with a payback period of 9 months. Major ROI drivers include higher productivity of finance teams and access to the most recent data.
![]()
$50,000–$100,000
Calculating and tracking major financial performance indicators (e.g., costs, revenue, cash flow) for SMEs with simple organizational structures and business models.
![]()
$200,000–$400,000
Calculating all required financial KPIs at a granular level (e.g., by subsidiary, region, department, product, customer group) for internationally distributed companies.
Advanced analytics capabilities:
![]()
+$50,000–$200,000
Root-cause analysis for financial performance indicators.
![]()
+$50,000–$150,000
Financial forecasts (statistical, ML-based), scenario modeling, and what-if analysis.
![]()
+$100,000–$200,000
AI-powered prescriptive analytics for financial planning and optimization.
Want to get a more precise figure?
Use our online calculator to describe your case and get a free cost estimate.
87% of Companies Report Tangible Business Value from Data and Analytics Investments
The 2024 Data and AI Leadership Executive Survey features feedback from 100+ Fortune 1000 companies that implemented data analytics. The report spans multiple industries, including healthcare (Mayo Clinic, Pfizer), BFSI (JP Morgan Chase, Wells Fargo), retail (Kroger, Procter & Gamble), manufacturing (Bridgestone America, General Motors), telecoms (Verizon), media and entertainment (Bloomberg, Facebook/Meta), education (University of Phoenix), and more.
Build Your Financial Data Analytics Solution With a Specialist Vendor
ScienceSoft maintains a team of data analytics professionals and dedicated corporate finance consultants with 10–25+ years of experience. Our experts are ready to apply their knowledge and skills to build secure, scalable, and future-proof financial analytics software for your company.

Consulting on financial analytics
Our consulting team will help you design a practical architecture and high-value features for your analytics system, pick the pragmatic tech stack, and optimize implementation project costs and timelines. We can also provide advice on data management, security, and compliance aspects of your financial analytics initiative.

Implementation of financial analytics
We build scalable and secure analytics solutions that provide a 360-degree view of financial operations and arm your finance teams with actionable insights on business growth opportunities. Our tailored solutions provide compliance with industry-specific regulations and support accurate, standardized financial reporting.
About ScienceSoft
ScienceSoft is a global IT consulting and software development company headquartered in McKinney, Texas. Since 1989, we've been helping organizations in 30+ domains build tailored analytics solutions that allow companies to benefit from streamlined financial management, informed decision-making, and increased business agility. An ISO 9001- and ISO 27001-certified vendor, we guarantee high software quality and complete security of our clients' data.
