The Real Difference between ServiceNow® Platform Performance Analytics and Reporting

Related topics:
Last updated:
Imagine that you live in central London, wear a deerstalker hat and possess a rare gift of deduction that lets you solve the most puzzling crimes. Your companion of medical background never seems to grasp how you do it, but he knows that your mysterious ‘mind palace’ lets you untangle the most tangled mysteries.
But even this Benedict Cumberbatch character, at first, would be puzzled by the difference between Performance Analytics and standard ServiceNow Reporting. And it is confusing: they both deal with data visualization and line charts.
So that you are not perplexed by it anymore, let’s have a closer look at ServiceNow Performance Analytics and what difference it makes.
Short summary:
ServiceNow Reporting vs. Performance Analytics
According to our ServiceNow consulting experts, Reporting is an OOTB ServiceNow plugin that allows making reports on data in the system. The report takes data from a particular table and makes a chart to display what you need.
Performance Analytics (PA) is also a ServiceNow OOTB plugin that provides data collection, analysis and visualization. However, you can use OOTB PA only for Incident Management. So if you want to have analytics for portfolio, financial, change, request, event management, etc., you’ll need to buy Premium PA.
Both tools visualize data in ServiceNow. So what’s the big difference?
Approach
ServiceNow reporting functionality and Performance Analytics differ immensely in their approach. The key difference is continuity and data collection.
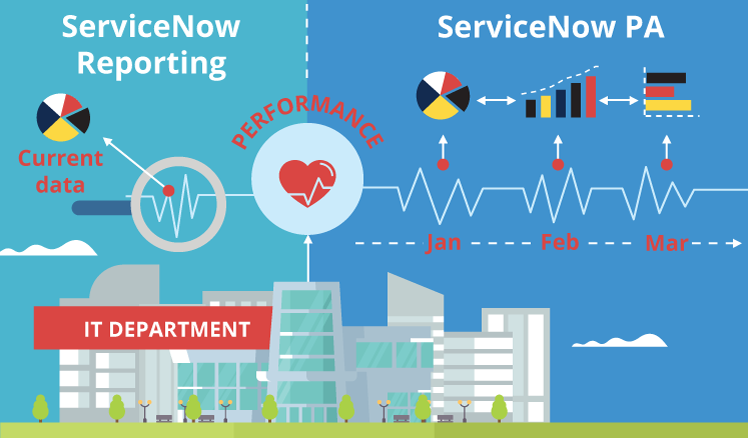
Let’s say, the performance of your IT department is its heart rate. Then, making a report on it would be a heart-rate checkup at a doctor’s office. It would show the current state of your heart rate as you’ll have access only to the current data.
You can do such checkups as often as you like. But what if the heart rate is surprisingly stable at the doctor’s office, whereas you feel something is wrong with it? What if the problem can only be noticed within a longer heart rate monitoring, say, lasting for days or weeks? That’s where you need PA.
Performance Analytics can be compared to a piece of medical equipment ‘attached’ to your IT department throughout all its activities - in the daylight and at night. This way, you can monitor your IT department’s health live. And this tool doesn’t only watch your IT’s heart rate constantly. It collects this data, analyzes, compares and visualizes it, identifying trends and making forecasts on how your IT will be doing in the future.
Given the constant monitoring and data collection, it’s no wonder that PA can provide new levels of insights. It allows you to:
- See real trends after comparing data from different intervals.
- View forecasts and act on them before any real damage is caused.
- Identify bottlenecks and continuously improve IT services.
- Automate daily activities (running reports, for example, as PA does it on its own).
Data collection process
In this article, you can find more about ServiceNow reporting process, but here are the basics. If you want a new report:
- Go to Report Builder/Designer.
- Determine what table you want to take the data from.
- Select how you want it grouped and visualized – and voila, there’s your report.
Since reports are based on the data taken from tables directly, they can only show what the situation is like right now. If something changes in a table (which happens very often), one and the same report run yesterday and today will show different things. And the exact difference between them will slip through your fingers, which is why you can’t analyze trends in performance properly.
This is why Performance Analytics follows a different process:
- Your ServiceNow admins define indicator sources, which are the places (in tables) where data will be extracted from.
- Then they determine indicators, which are the ‘I’ in KPIs (Key Performance Indicators), for instance, average open age. ServiceNow PA has 3 groups of indicators: automated (for long periods of data collection), manual (for specific historical data) and formula (for calculations and manipulations with the previous two). Data collected for one indicator over time results in a series of indicator scores, which display data extracted from a particular table at regular intervals.
- Your IT specialists set up breakdown sources to make sure that you get the results you need when you look at data broken down by a different element (average open age broken down by the ticket’s priority, for example).
- Now that we’ve got all the ‘boxes’, we need to fill them in with data. For these purposes, specialists run data collection jobs. They can be historical (with past data) and ongoing (with new data). This way, indicators get ‘filled’ with their true essence – scores (the data itself).
- Then, ServiceNow’s intelligent automation engine analyzes, compares and visualizes the data.
- The only thing left for a user to do is view the scorecards and widgets and create new dashboards, if they want.
So, PA regularly documents your IT department’s performance data (or heart rate), analyzes the difference between intervals and shows real changes in performance. Whereas Reporting can only show you what the tables have stored in them now.
Interface
PA’s interface is more comprehensive than that of Reporting:
- Apart from different ways of displaying data (scorecards, scoresheets, widgets), PA offers a much more interactive interface. You can change the chart’s date range right there, in the report itself, and the line will change accordingly. While with standard OOTB Reporting, you’ll have to go to Report Builder/Designer to change the report’s settings.
- You can ‘work’ with visualizations setting targets and thresholds as well as adding comments to scorecards. And when your IT is about to reach a threshold, which is undesirable, the system can notify the people responsible for it. It allows reacting to alarming trends more effectively.
- PA has a much more structured organization of visualizations. They are all grouped by a particular category, which is simply more convenient than a bunch of unorganized OOTB reports. At the same time, you can customize your Reporting to make charts more organized.
- PA also offers more predefined indicators in each category you have. There are lots of ready-to-use dashboards, also organized by category.
Who needs ServiceNow Performance Analytics?
To put it briefly, reporting is used for operational management. You can use it to check the current situation and react on current problems. PA is, however, used for strategic management. It helps you see the bigger picture and analyze performance behind everyday activities. Thus, if you need strategic management, you go PA. If you don’t, reporting will do.
Usually, large or mid-sized companies with complex IT processes and infrastructure use PA. They already have considerable investments in ServiceNow and tend to have clear IT performance measurement strategies.
But smaller companies should think again, when aiming their arrows at PA, since it is not a cheap tool. In fact, it is expensive. So if your company doesn’t have a huge IT budget, it’s not for you. You can use the free complementary PA version for Incident management, but it’s only there to tease you into paying more. All the rest useful ServiceNow contents are only available with Premium PA.
Besides, if your company – regardless of its size – uses BI extensively, you may need to think twice before buying PA Premium. Paying for both may be too much, since they can do almost the same thing, if you add ITSM into your enterprise BI.
In short
Due to collecting data at regular intervals, analyzing and forecasting trends, ServiceNow Performance Analytics allows new levels of in-depth insights into your IT. But it comes at a high price. Your needs may be fully covered by Reporting, if your level of ITSM maturity doesn’t require a strategic analysis of IT performance. Besides, if your company has already invested a lot into BI, the pros and cons of using PA must be double checked, which is something ServiceNow consulting can help you with.
