Is ServiceNow® Platform Reporting Good Enough?

Related topics:
Last updated:
When it comes to management, no one wants to make wrong decisions. But it may be impossible to find the right ones, if you do not have all the information you need. And this is where ServiceNow reporting comes into play: it helps IT service managers to analyze data and choose the right course of action. In this article, we will explore reporting capabilities of the platform: what it allows out-of-the-box and how to enrich its reporting functionality with a proper customization.

What’s with ServiceNow’s out-of-the-box reports?
The list of ServiceNow’s out-of-the-box (OOTB) reports is not that long. Basically, it covers all the more general domains:
- Incident, problem, change, request, SLAs, assets, configuration items and contracts data.
- KPIs (first-time resolution rate, incidents per problem, remotely resolved incidents, etc.).
- Service Desk surveys (overall experience evaluation, technical competencies, first call resolve, etc.).
- Knowledge Base Feedback (most helpful or not useful articles, article view count, etc.).
Our ServiceNow consulting specialists say that it may be enough for companies, if they don’t need to analyze some specific areas of their work, say, how many reopened incidents there are per Tier 1 employee. But other enterprises may find themselves in need of a more comprehensive tool that would cover much more than just the general. And ServiceNow can be that tool, once you work some magic.
What more can ServiceNow reporting analytics do?
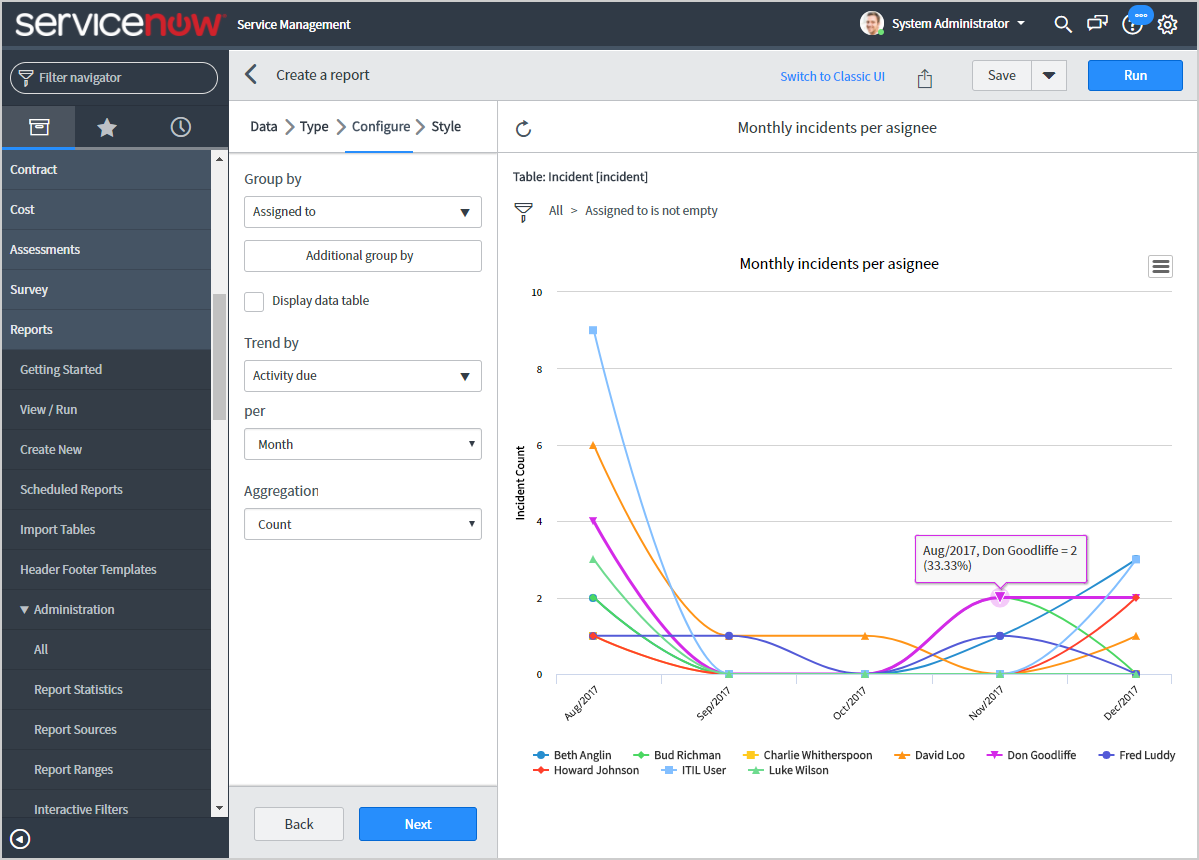
If you need to dig deeper, say, to know the median number of days it takes to identify a root cause, the list of ready-to-use reports won’t be helpful enough. However, there’s no need to get upset. ServiceNow provides quite a sufficient OOTB reporting functionality that includes a possibility to create reports yourself, if you want something that’s not on the list. To create such custom reports, use a built-in reporting tool: either Report Builder or Report Designer (both do roughly the same thing, providing a possibility for advanced reporting). Here's what Report Designer looks like:
Once you’ve explored ServiceNow’s custom reports potential, reporting can start to really bring clarity to your IT services. It can help you make informed decisions about IT by having three things under control: IT service provisioning, IT support resource consumption and team performance.
IT service provisioning
ServiceNow provides numerous ways to monitor end-to-end IT service delivery. Using custom reports in ServiceNow, you can see:
- Mean and median first response time
- Top breached Service Level Agreements (SLAs)
- Reopened incidents frequency
- Number of service interruptions
- Downtime (how long particular IT services were unavailable)
- Service availability rate and much more
Using different kinds of reports, ServiceNow visualizes how well your IT support copes with their duties and how stable the results of their work are.
IT support resource consumption
Not only should every IT support team work promptly, but also mind the costs. And that is something ServiceNow reporting can help you with. To control adherence to budget, you can examine reports on:
- Total IT expenses by different departments/locations.
- Number of IT support units exceeding the budget.
- Problems/incidents/changes that caused budget overrun.
- Amount of extra money spent, etc.
Team performance
There’s no way to optimize IT support without examining individual performance of each team member. ServiceNow can identify problem areas in the performance of IT staff and compare employees to one another by analyzing the following data:
- Level of users’ satisfaction with IT staff performance
- Resolved and unresolved incidents/problems
- Successful and failed changes
- First response time
- Downtime per employee
- Fulfilled/breached SLAs
- Repeated incidents per assignee
- Contributions to the Knowledge Base
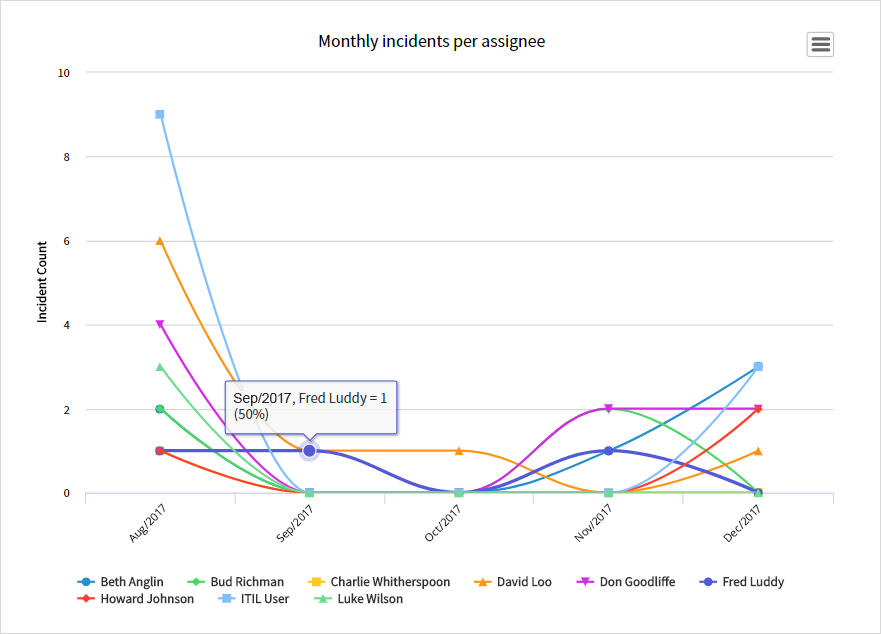
Here’s an example of a simple custom report displaying how many incidents were assigned to each employee over a given period of time.
Keep in mind
The enlisted reports are just an illustration. ServiceNow allows much more: it can visualize other KPIs, make your IT support consumption clearer or reflect the specifics of IT service provisioning in your company.
On the downside, working with Report Builder or Report Designer may sometimes get very tricky. And combining that with a number of ServiceNow reporting limitations listed later in the article, you may need to turn to ServiceNow consulting to get the reporting functionality you need.
Is ServiceNow reporting convenient?
All in all, ServiceNow reporting is a convenient tool. Here’s why:
1) ServiceNow reporting exists within one platform with the data itself, so you don’t need to juggle with applications.
2) ServiceNow provides multiple built-in features that help create and use reports:
- Various types of reports (pies, donuts, maps, bar charts, lines, bubbles, histograms, etc.) to represent different types of data.
- Powerful drill downs – multi-layer reports to cover and visualize much more data than with simple ones. They work like this: when you create one report, say, a bar chart, and click on one of the bars, you’ll see another report – a drill down – displaying another aspect of the given data.
- Handy multi-condition filters to simplify both the creation and the search of reports.
3) Reports can display real-time data. You don’t need to create new reports each time you need to see real-time numbers. You can make one report and then just look it up whenever you need to.
4) You can schedule reports, and ServiceNow will run them and send to particular users automatically based on set rules.
What about data safety?
ServiceNow offers a possibility for access management. Only users with itil roles can create reports. Non-itil users can only see reports shared with them, which is why you have to be careful at it, if the report contains sensitive data. To make sure your reports-related policy is thought through, ServiceNow enables security admins to forbid the creation of particular reports or make some roles an obligatory condition for it.
What are the concerns of ServiceNow reporting?
Like just about anything, ServiceNow reporting isn’t ideal. It has a number of peculiarities, when it comes to:
- Dates, data groupings, calculated fields, parameterized reports and other complex reporting. For instance, what if you need to see the interconnectivity between an average time of first response to a Priority-1 incident and the possibility of its resolution within one hour? It can be too complex to handle without a professional. Or you can even need an external reporting solution.
- Custom charts and views for complex reporting. Although you can create custom charts and views to make complex reports, substantial knowledge of Jelly and JavaScript is sometimes required.
- Data quality. Since the data used for reports is stored in tables that are formed by manually inputting information (at some point), the quality of the data can be rather low. Consequently, if data isn’t input or cleansed properly, it becomes impossible to see adequate reports.
- System overload. If too many ‘heavy’ reports sitting on homepage dashboards with calculated fields and multiple drill downs are run at the same time, the system gets easily overloaded. That’s why it needs to be carefully maintained.
In a nutshell
Q: Are out-of-the-box reports enough?
A: It depends on your company’s demands. If you don’t need to go deep, they’re sufficient. But if you need to perform some advanced reporting, then not.
Q: What can ServiceNow reporting actually do besides OOTB reports?
A: Create custom reports that will provide more visibility to your IT service provisioning, team performance and resource consumption as well as help to optimize IT services on the whole.
Q: How convenient is it to use ServiceNow reporting?
A: Rather convenient due to different report types, filters, drill-down reports, etc.
Q: What are the weaker points of the tool?
A: Limitations of complex reporting, low data quality, system overload in case of mismanaged reporting.
