 ScienceSoft Global



Outpatient Growth and Rural Hospital Conversions: Trends Reshaping US Hospital Care in 2026


Related topics:
6 min read
Last updated:
ScienceSoft is an AI transformation and software engineering company working with US healthcare organizations on IT strategy, software development, and modernization initiatives. Drawing on our healthcare IT experience and ongoing industry research, we track the structural changes shaping hospital care in the US. We expect the gradual decline in inpatient admissions to continue over the next several years. At the same time, the scope and volume of preventive and outpatient services are likely to expand.
Revision history
- Current 2026 edition: updated hospital utilization, workforce, health spending, rural care, interoperability, and telehealth data.
- 2025 edition: view archived statistics.
Hospital Care Is Shifting Toward Outpatient Services
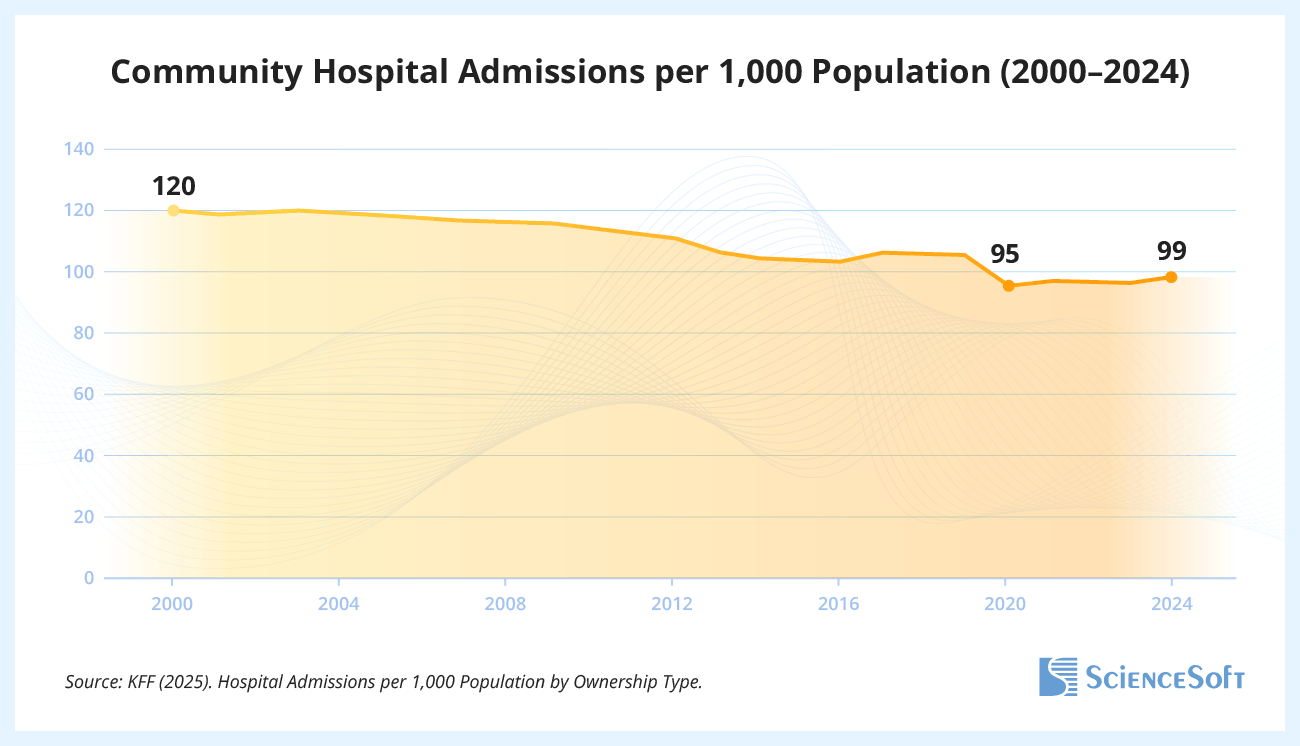
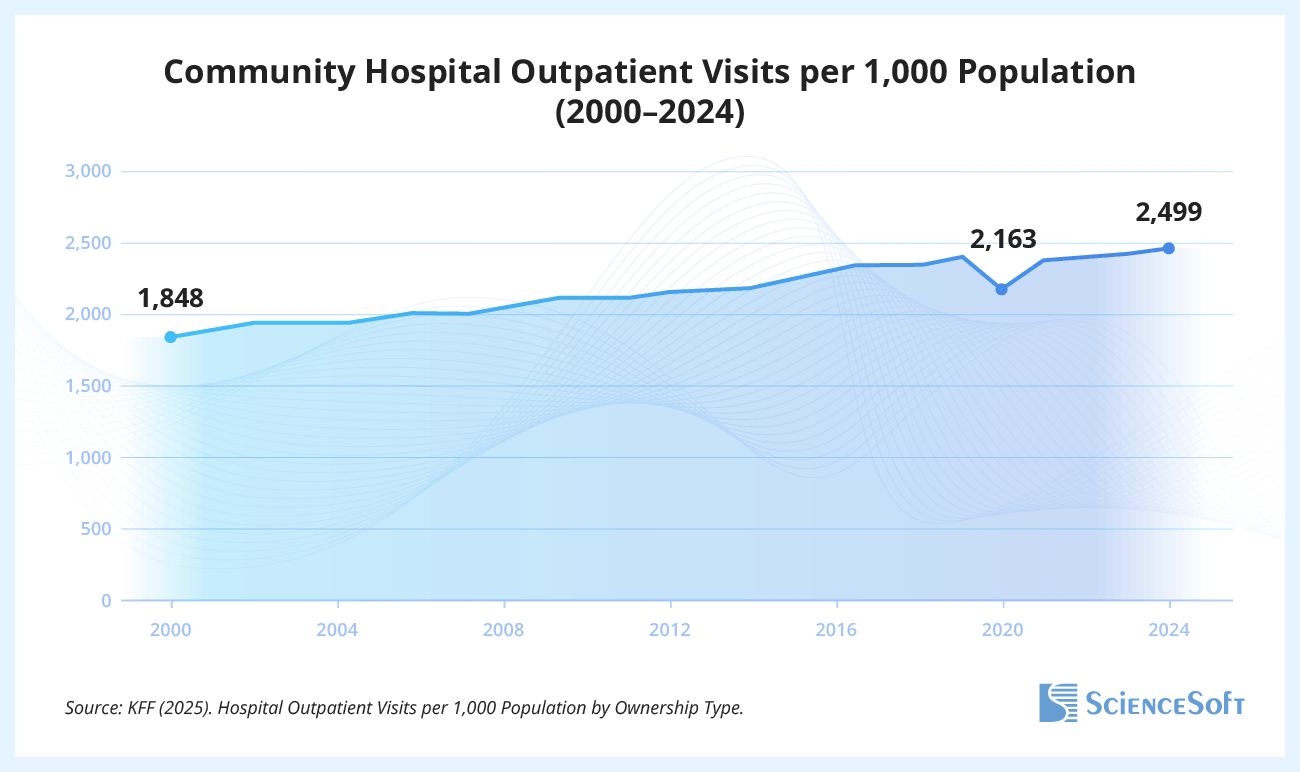
US hospital care is moving away from overnight stays over the longer term. Between 2000 and 2024, community hospital inpatient admissions per 1,000 people fell by 17%, while outpatient visits rose by 35% (KFF).
The hospital footprint has adjusted accordingly. Staffed community hospital beds per 1,000 people declined by about 21% over the same period (KFF), while average occupancy in general acute care hospitals was well below full (71%) in 2024 (MedPAC). The role of the inpatient setting is becoming narrower.
Several forces are pushing care in that direction. Better diagnostics and less invasive treatment make it possible to discharge patients sooner or avoid hospitalization altogether, while preventive care and chronic disease management can move more treatment into outpatient settings. Emergency care shows a related, though less clear-cut, trend. From 2008 to 2023, treat-and-release ED visits grew by 15%, compared with 8% growth in ED visits resulting in admission (HCUP Fast Stats). Both categories increased, and the figures are not adjusted for population growth, but the gap in growth rates is still notable.
Fewer inpatient stays mean less reliance on beds as the center of the care model and greater importance of outpatient, diagnostic, emergency, and follow-up services. At the same time, hospitals cannot optimize purely for average demand: sudden surges in severe cases still require staffed beds and clinical capacity that may look underused in normal periods. The challenge now is to preserve the ability to expand inpatient capacity when needed, including the staff, equipment, and clinical resources required to make those beds usable.
Fewer Beds Almost Everywhere: Some States Are Barely Covered
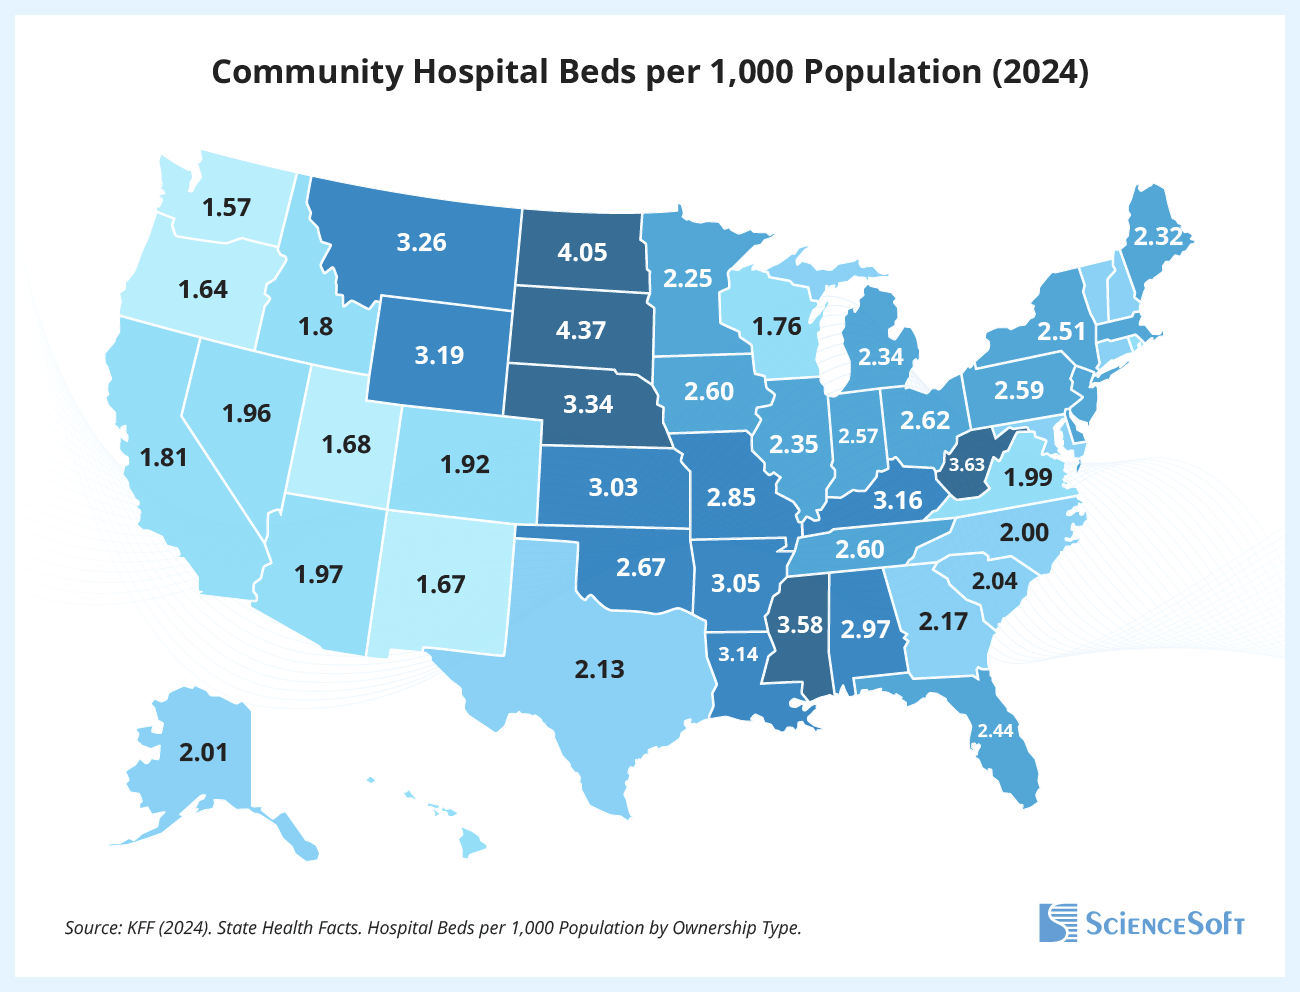
Almost every state has fewer beds than a generation ago. According to the Kaiser Family Foundation, from 1999 to 2024, 49 states (except Alaska) recorded declines in community hospital beds. The sharpest decline occurred in Wisconsin, where bed numbers fell by 43%. The latest available data shows that South Dakota now leads with 4.37 beds per 1,000 people, while Washington state has only 1.57 (KFF).
The number of hospitals mirrors this uneven picture. Texas tops the list with 498 hospitals, followed by California and Florida, while smaller or more rural states such as Delaware, Rhode Island, Vermont, and Alaska each have fewer than 20 (AHA). Regions with fewer hospitals per capita often overlap with those with the lowest bed density, leaving many communities thinly covered even before accounting for distance or specialization.
At large, the decline in beds reflects the same long-term movement toward outpatient care seen across the hospital system. But not all states have been affected equally. Some regions now face much tighter capacity, which becomes especially problematic when a crisis sends a sudden wave of patients their way.
Hospital Employment Is Growing Within a Stable Hospital Footprint
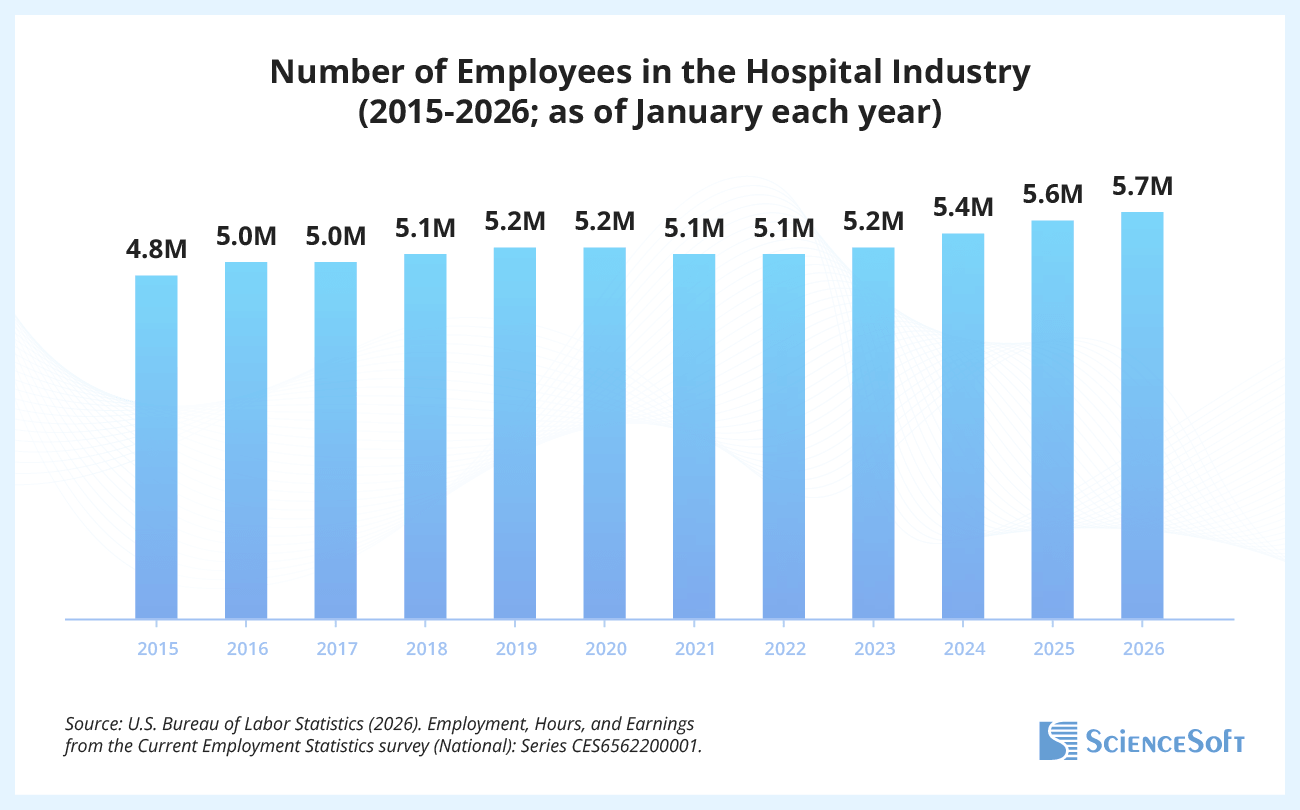
US hospitals are adding staff even as inpatient care accounts for a smaller share of activity. Private hospital employment remained relatively stable at around 5.0–5.2 million workers from 2016 through 2022, then began rising more quickly, reaching 5.7 million in January 2026 (U.S. Bureau of Labor Statistics).
At the same time, the number of hospitals has barely changed. The US had 6,100 hospitals in 2024, compared with 6,090 in 2019 (American Hospital Association). This means employment growth is happening largely within an existing hospital footprint. Part of it likely ties to the changing service mix: as more care moves into outpatient settings, hospitals support a broader range of diagnostics, emergency services, care coordination, and other functions beyond traditional inpatient units.
According to the AHA Hospital Statistics, 2026 edition, there were 6,100 hospitals in the United States as of 2024. 5,121 of them were community hospitals, and 979 were non-community hospitals. Among community hospitals, 2,984 were nonprofit, 1,224 for-profit, and 913 state- or local-government-owned. Among non-community hospitals, there were 656 non-federal psychiatric hospitals, 210 federal government hospitals, and 113 others (non-federal long-term care hospitals and hospital units within an institution such as a prison hospital or school infirmary).
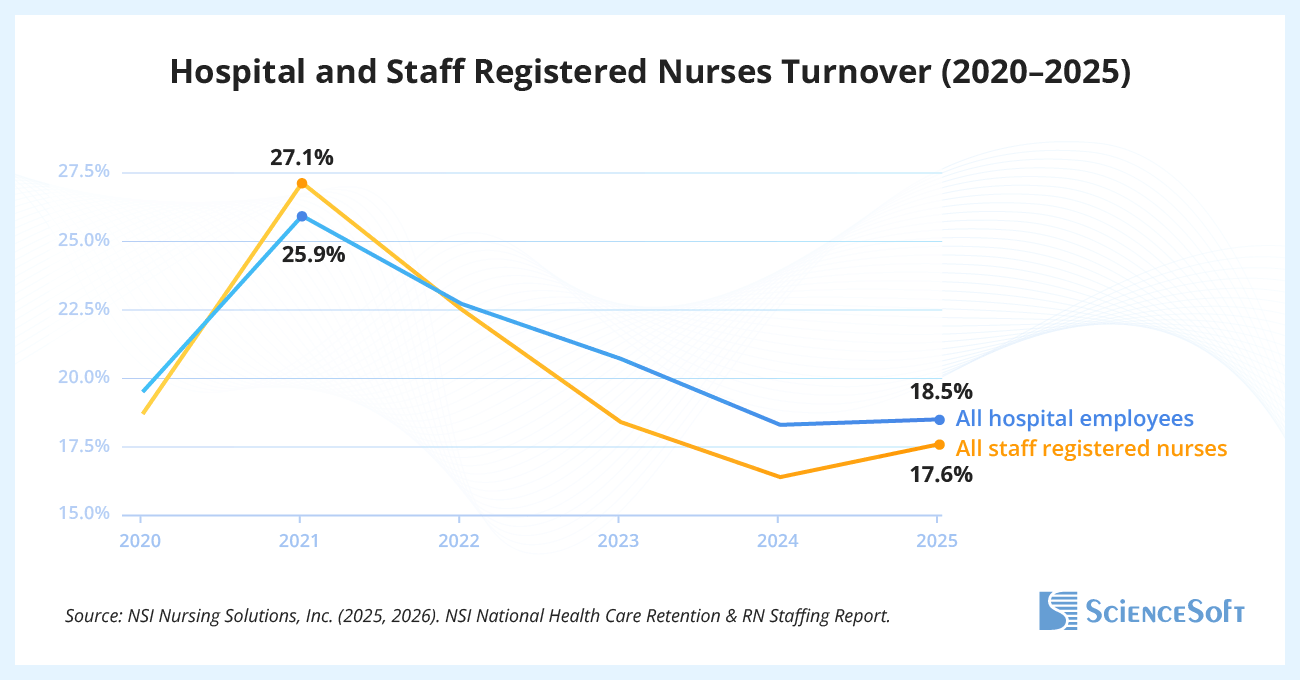
Workforce churn has also come down from its pandemic-era peak. According to NSI Nursing Solutions’ hospital survey, total hospital employee turnover fell from 25.9% in 2021 to 18.5% in 2025, while registered nurse turnover declined from 27.1% to 17.6%. Lower turnover makes service expansion easier to sustain, as a larger share of hiring can support growing care needs instead of simply replacing departing staff. Still, the improvement appears to be leveling off: both measures ticked up again in 2025 after falling in 2024.
Rural Hospitals Are Closing — or Changing Form
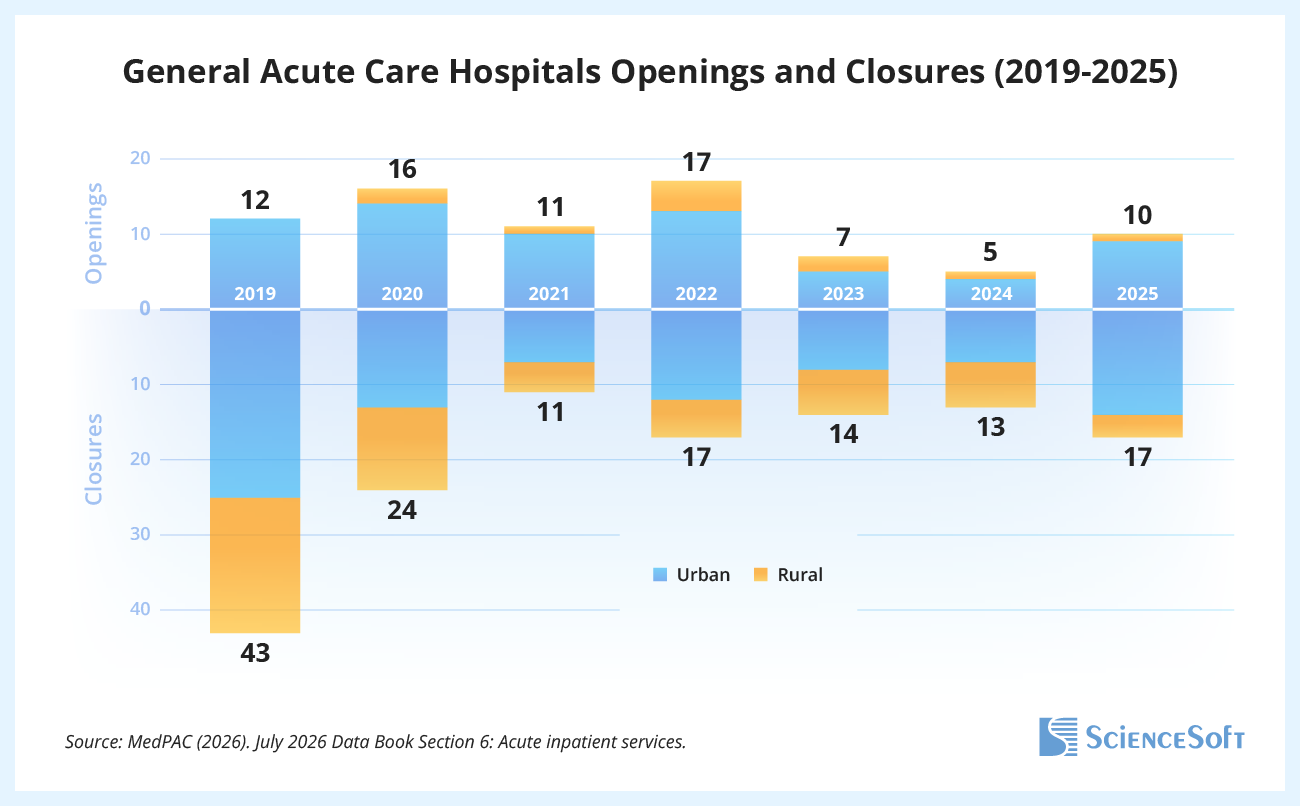
Hospital closures continue to outpace openings across the US. From 2019 through 2025, 139 general acute care hospitals closed while only 78 opened (MedPAC). The problem is especially acute in rural areas: 11 openings versus 59 closures over the same years. According to the American Hospital Association, rural facilities account for about 35% of US community hospitals, so losing one can leave patients with few nearby alternatives for time-sensitive care.
Since 2023, some facilities have converted to Rural Emergency Hospital status, which allows eligible hospitals to stop providing inpatient care while continuing emergency and outpatient services. Rural hospitals recorded 9 such conversions in 2023, 16 in 2024, and 10 in 2025 (MedPAC). For local communities, the designation offers a way to preserve at least part of hospital care rather than lose the facility altogether.
Still, rural hospitals trail urban facilities considerably on the economics of patient care: in 2025, the median patient-service margin for rural short-term acute care hospitals was 2.4%, compared with 10.5% for urban hospitals. Their total margins were much closer (5.4% versus 6.6%) because investment income, grants, local tax revenue, and other non-patient sources partly make up for weak or negative returns from patient care (Center for Healthcare Quality and Payment Reform).
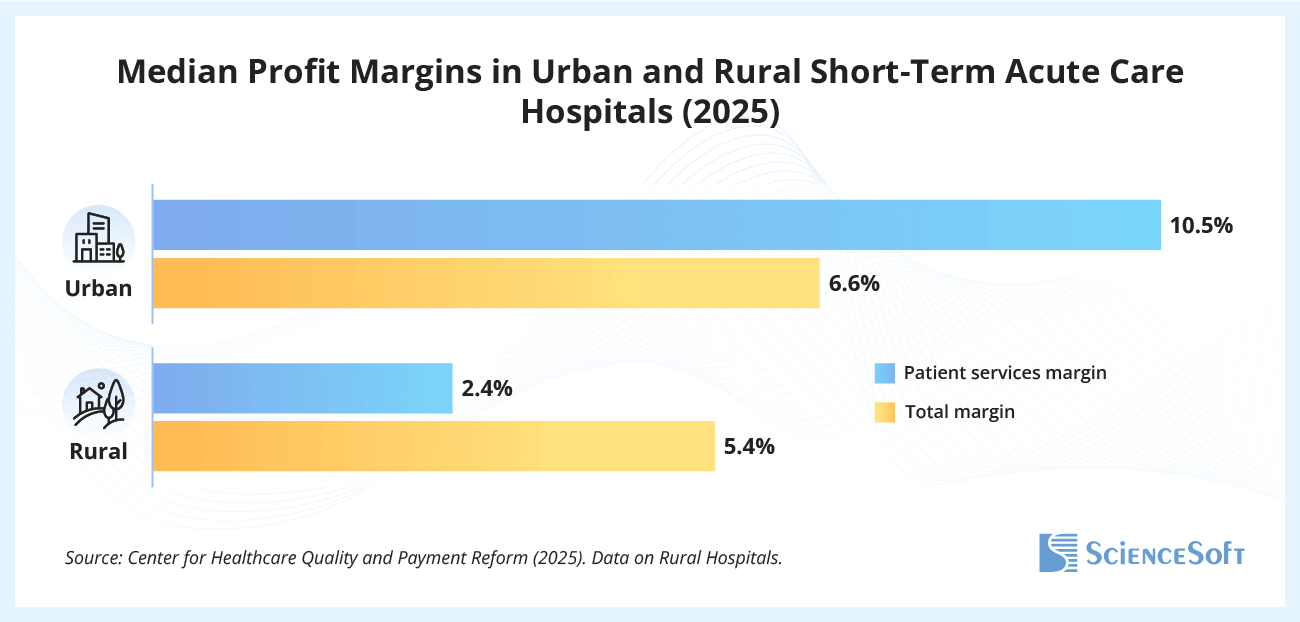
Note: CHQPR uses a nonstandard margin formula, dividing the difference between revenue and costs by costs rather than revenue, so its percentages are not directly comparable with conventionally calculated hospital margins. Its table also draws on each hospital’s most recent available fiscal year report, meaning the figures do not represent a single common reporting year.
The Barbell Effect: Tiny and Mega Hospitals Thrive
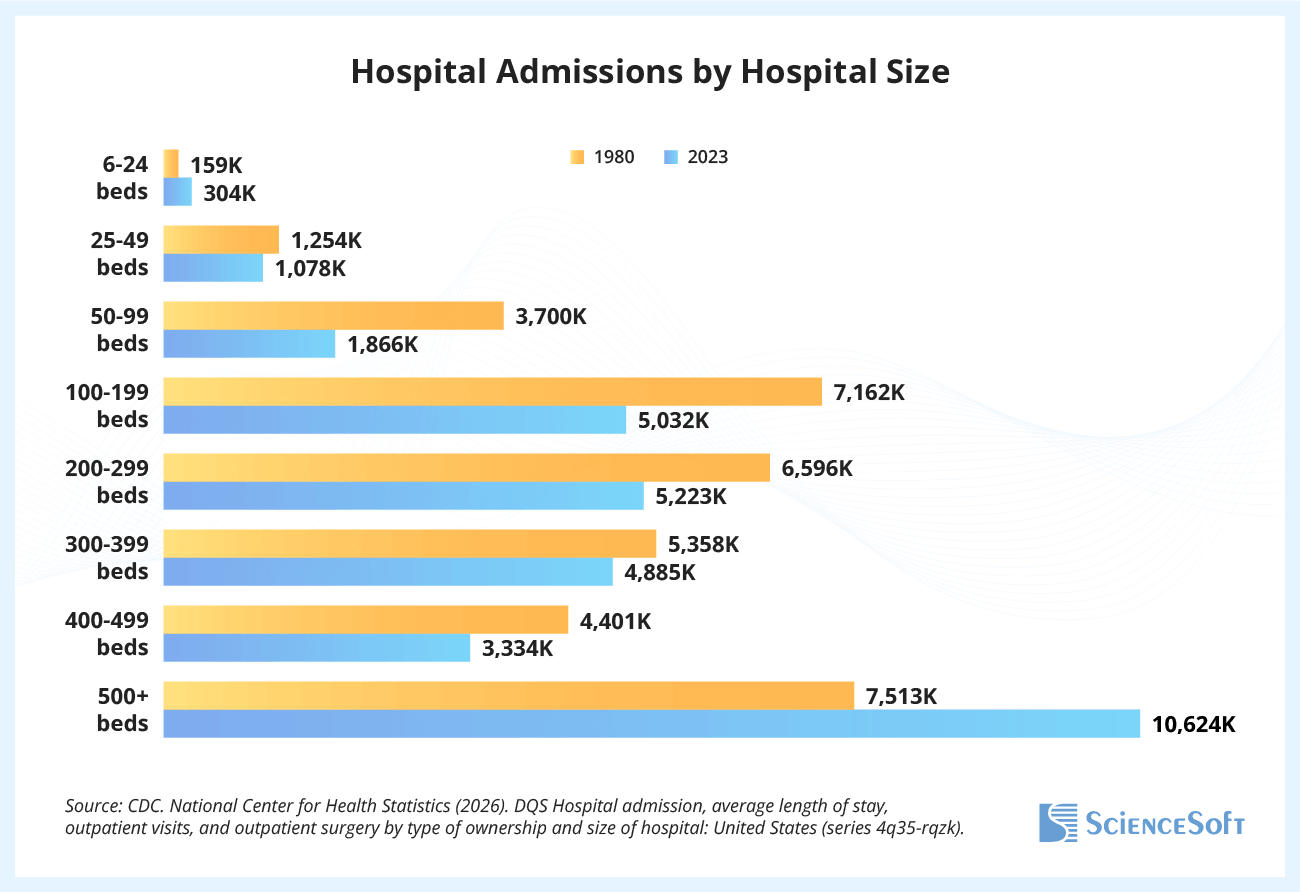
The demand has long been consolidating at the extremes. Over the past four decades, the smallest hospitals (6–24 beds) and the largest hospitals (500+ beds) have both seen admissions rise, while mid-sized facilities lost ground (National Center for Health Statistics).
This breakdown reflects diverging roles. Very small hospitals — often in rural areas or specialized niches — continue to serve as vital community anchors, providing essential access where larger facilities are impractical. On the other hand, mega-hospitals are expanding as regional hubs for highly complex procedures, advanced technology, and specialist teams.
The middle is squeezed. Hospitals with a few hundred beds increasingly face the worst of both worlds: too large to be lean community providers, but too small to compete with the scale, technology, and negotiating power of major academic centers and system flagships.
Out-of-Pocket Burden Grows
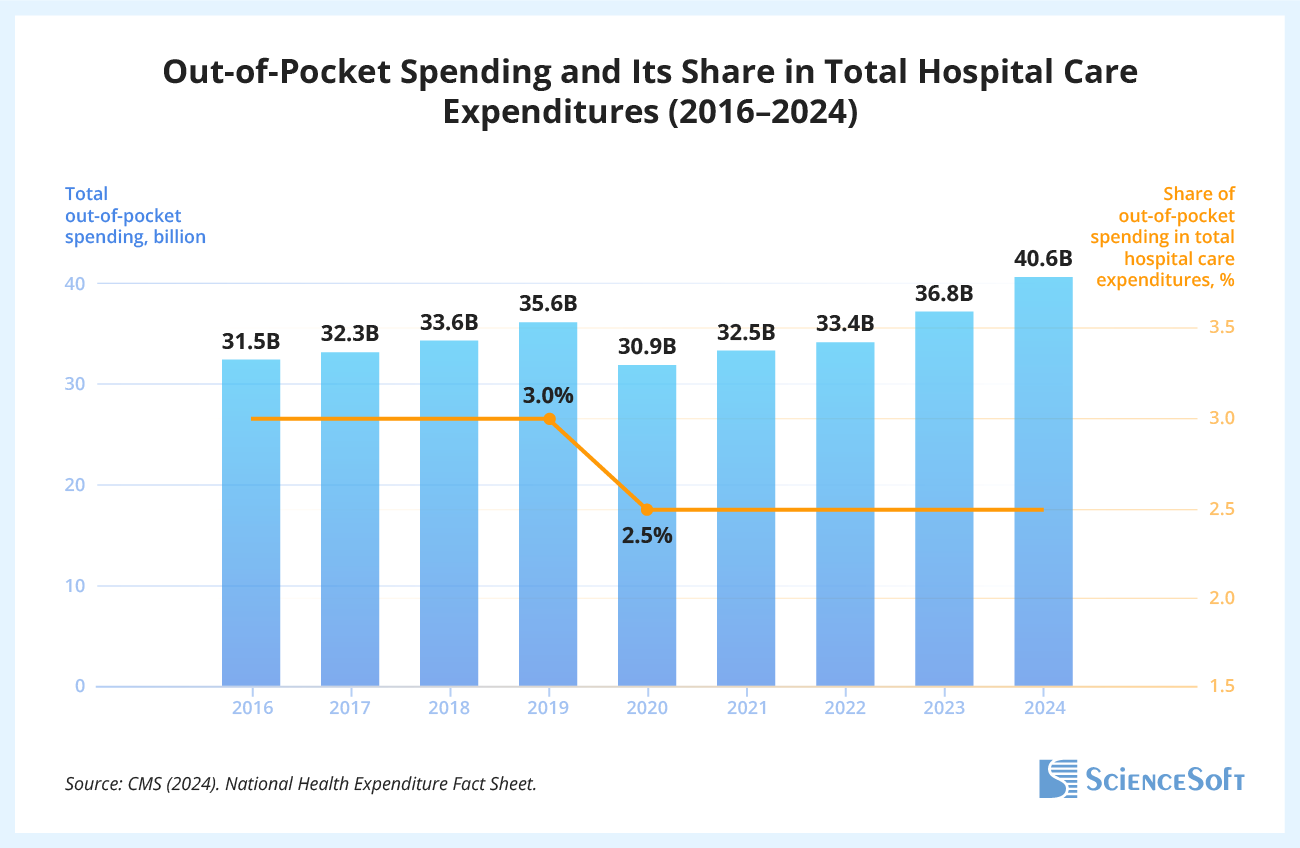
For patients, these structural shifts intersect with another pressing reality: the rising cost of care. Total out-of-pocket spending on hospital care rose from $31.5 billion in 2016 to $40.6 billion in 2024 — an increase of almost 30% (Centers for Medicare & Medicaid Services).
The rise has happened against a relatively stable long-term volume of inpatient care. The US recorded about 36.1 million hospital admissions in 1975 and 35.7 million in 2024 (National Center for Health Statistics, American Hospital Association). This means the increase may be coming from higher costs per hospital stay, greater spending on the growing volume of outpatient services, or both.
Counterintuitively, patients are actually covering a slightly smaller share of hospital spending than they did several years ago. Out-of-pocket payments accounted for 3% of total hospital care expenditures in 2016, fell to 2.5% in 2020, and remained there through 2024 (Centers for Medicare & Medicaid Services). But that smaller share still translated into a growing amount of money paid directly by patients.
Hospital Interoperability Has Become the Norm
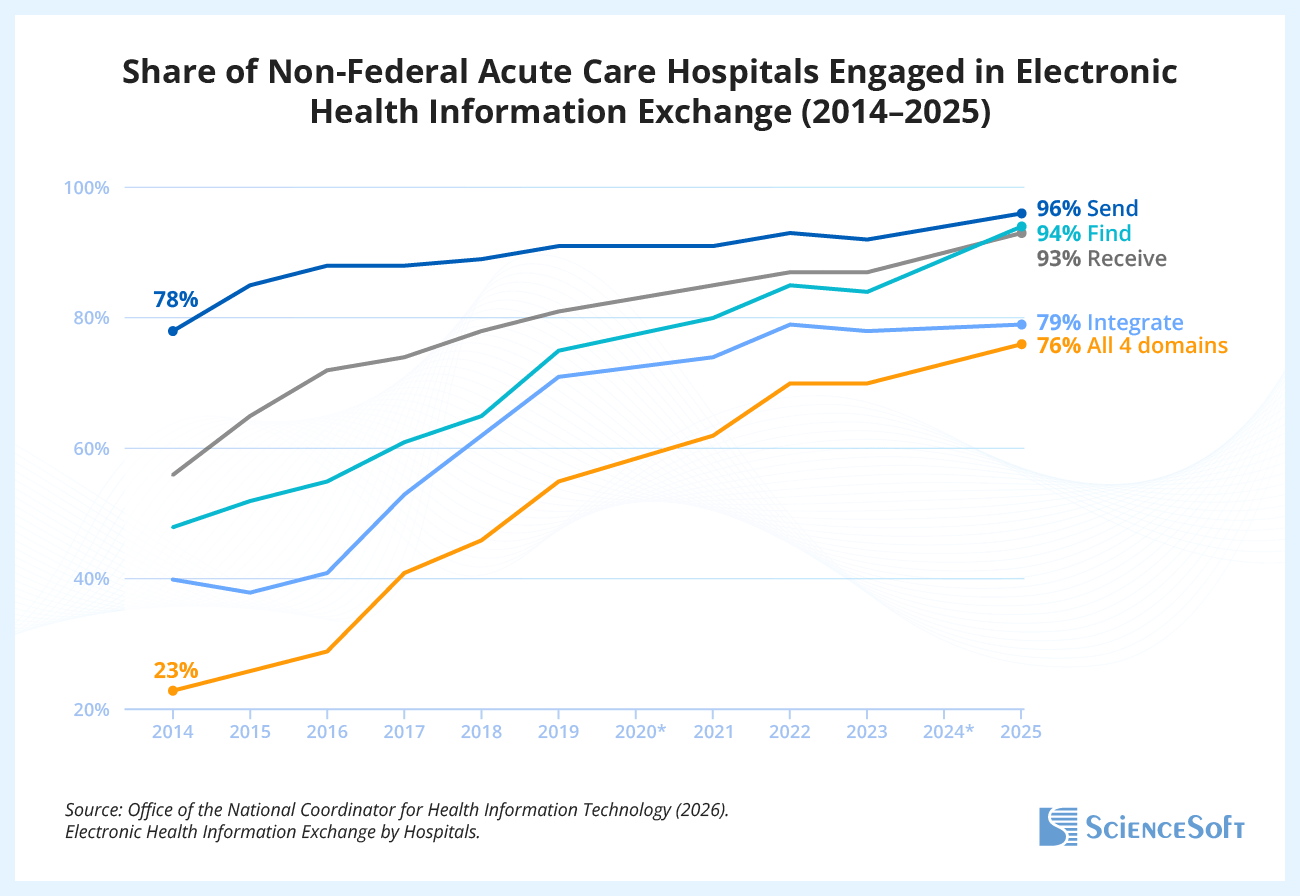
Hospital interoperability has advanced substantially over the past decade. In 2014, only 23% of non-federal acute care hospitals were engaged in all four core interoperability activities: sending, receiving, finding, and integrating electronic health information. By 2025, that share had risen to 76% (HealthIT.gov).
In 2025, 96% of non-federal acute care hospitals could send electronic health information, 93% could receive it, and 94% could find it. Automatic integration remained less common: 79% reported that their EHR could incorporate electronically received summary-of-care records from outside providers or organizations without staff having to enter the information manually (HealthIT.gov). The remaining challenge is reducing manual reconciliation and getting external records into the EHR in a form clinicians can use directly.
Efforts to standardize health information exchange at the national level are also starting to show results. In 2025, 43% of non-federal acute care hospitals reported participating in the Trusted Exchange Framework and Common Agreement (TEFCA), while another 37% planned to participate (HealthIT.gov). The results are based on responses from 55% of non-federal acute care hospitals, so they should be interpreted with some caution, but they still indicate substantial momentum behind a common framework for cross-organizational data exchange.
For hospital IT teams, the next step is making exchanged data usable at the point of care: integrating external information into clinical workflows, normalizing incoming data, resolving duplicates, and reducing the manual work needed to reconcile records from different systems.
Telehealth Is Settling Into a Lasting Niche
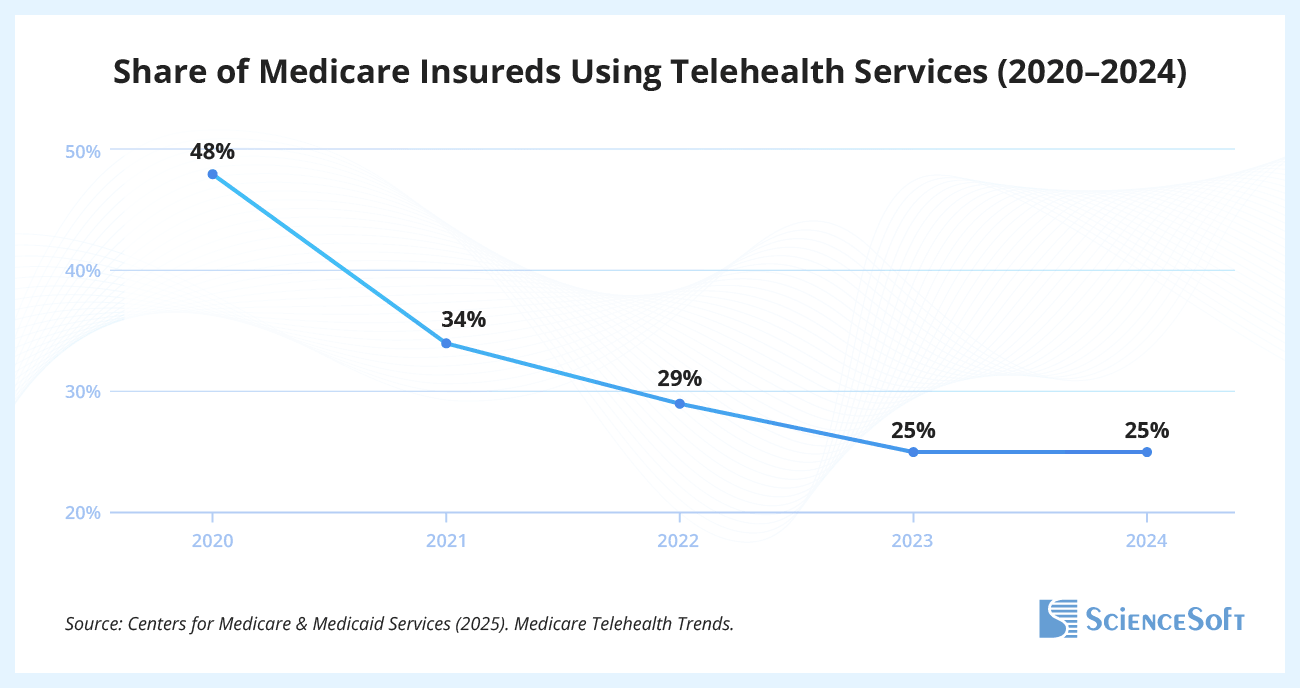
Telehealth use has fallen well below its pandemic peak, but it has not faded from routine care. Among Medicare fee-for-service beneficiaries who received a telehealth-eligible service, telehealth use dropped from 48% in 2020 to 25% in 2023 — and then held at the same 25% level in 2024 (Centers for Medicare & Medicaid Services).
Telehealth is also widely embedded in hospital infrastructure. About 60% of the 4,500 US hospitals analyzed by Definitive Healthcare have a telemedicine solution in place.
After the decline from the pandemic peak, usage appears to have settled at a substantial level. This suggests telehealth has found a more durable place in care delivery. ScienceSoft expects this role to expand gradually and estimates that virtual care could account for one in ten US medical visits by 2030.
For hospitals, the focus is therefore shifting from simply offering virtual visits to deciding where telehealth adds the most value alongside in-person care. That means prioritizing use cases where remote access can reduce unnecessary travel, extend specialist reach, or support follow-up care without adding another disconnected channel to the patient journey. Mental health is the clearest example: in March 2026, 28.5% of mental health encounters were conducted via telemedicine, far ahead of any other specialty. Remote care fits particularly well here because many consultations do not require a physical exam and can spare patients the time, cost, and additional anxiety of an in-person visit.
Want to explore these insights in greater depth? Connect with ScienceSoft's experts to discuss how these trends translate into practical strategies for healthcare organizations.
