
BI Solution for Multidimensional Financial Analytics across 30 Parameters
About Our Client
Headquartered in Texas, the Client is an international company (with about 300 employees) that is an expert in commercial and residential real estate development.
Challenge
Aiming to gain deeper insight into their business, the Client wanted to establish comprehensive financial reporting. Instead of disparate data unsuitable for data analysis and for making informed decisions, the Client wanted to receive an efficient reporting tool based on the aggregate data.
Solution
In the course of the project, ScienceSoft’s BI implementation team, consisting of a data analyst, a database developer, and a senior BI developer, delivered the following:
- Data warehouse based on Microsoft SQL Server
- ETL using Python
- Data integration from about 40 sources
- Data cleaning and merging
- Analytical cube development with 15 dimensions and 30 measures
- Integrated financial and analytical reports and dashboards based on Power BI
Since the Client needed a comprehensive financial analysis, ScienceSoft developed the reports to analyze the following indicators:
- Income
- Operating expenses
- Net operating income
- Net profit
- Operating cash flow
- Change in cash
- Current assets
- Fixed assets
- Current liabilities
- Long-term liabilities
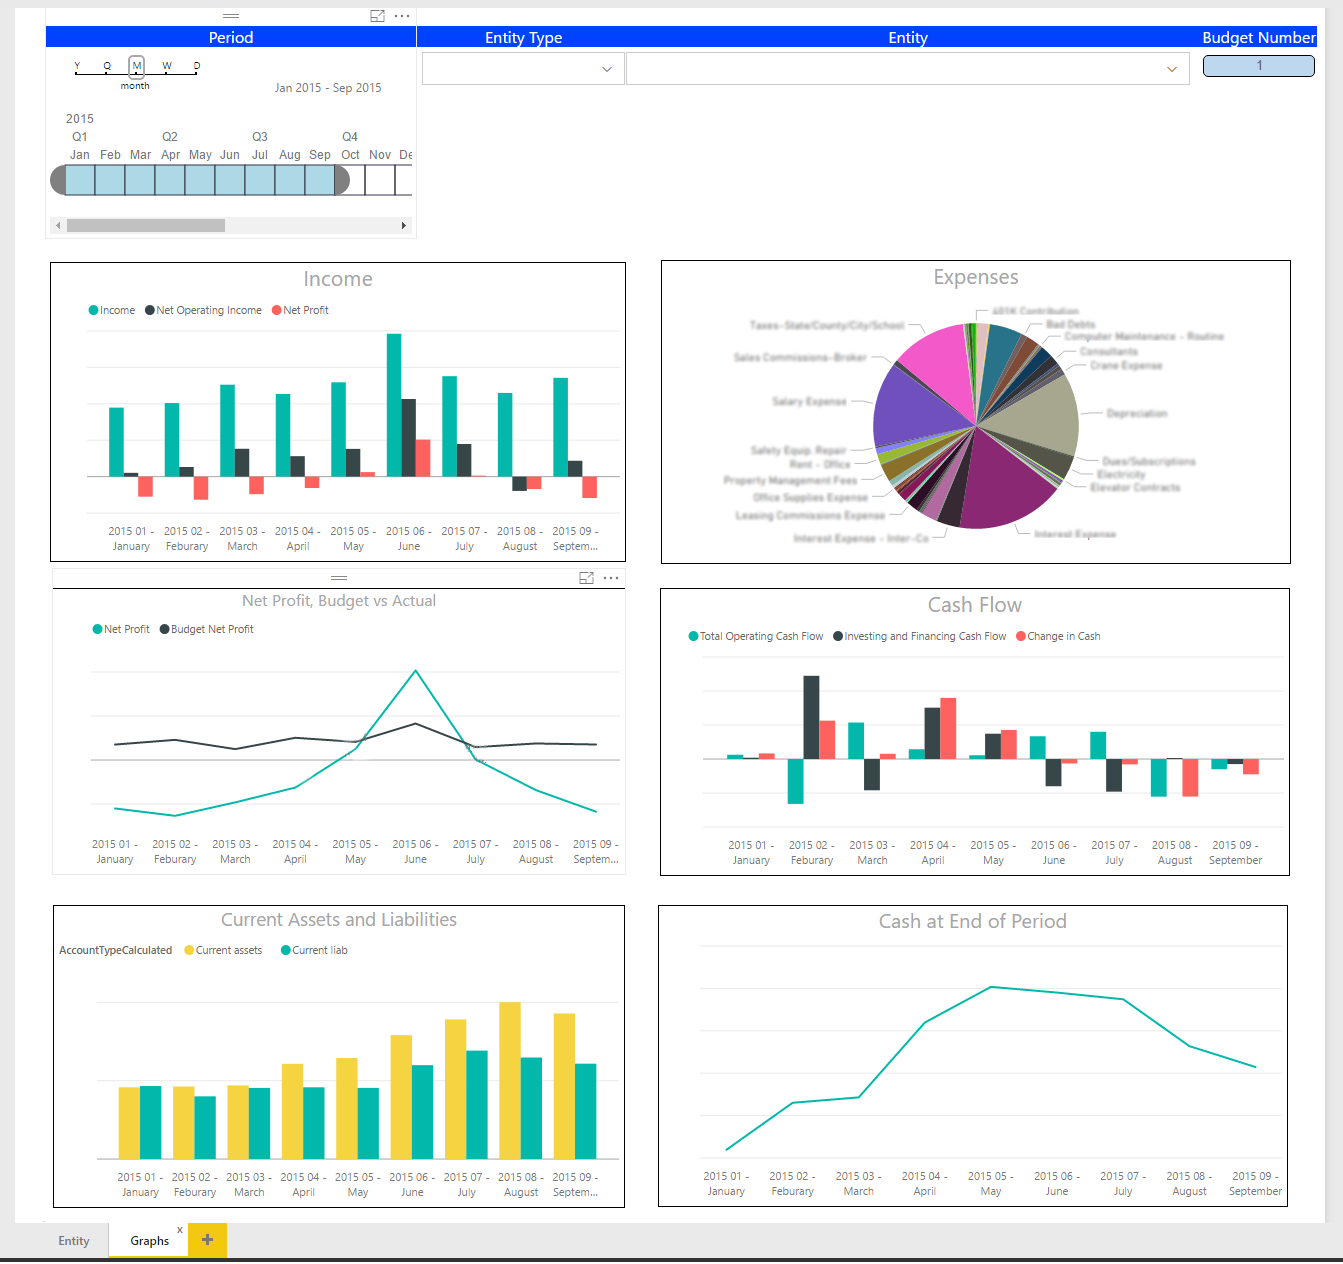
To enable the Client to get an overall picture and spot the trends, ScienceSoft also delivered dashboards and consolidated reports listed below:
- Balance Sheet
- Cash at the end of the period
- Current assets and liabilities
- Income
- Expenses
- Cash flow
- Net profit
The reports show the data for both the entire company and the branches. Additionally, any attribute can be chosen to filter the data (including the hierarchy of branches, accounts, and dates).
Results
At the end of the project, 17 reports (with different levels of detail) and 5 dashboards allowed the Client to look at the aggregate financial data from any perspective and, consequently, better understand their business. Besides, the Client was able to analyze the cash flow, spot the trends, and quickly react to a changing environment.
Technologies and Tools
Microsoft SQL Server (DWH), Python (ETL), Microsoft Power BI (Reporting)

