QRadar Health Monitoring with QLEAN: Why Go For It?

Related topics:
Last updated:
Your company has purchased a QRadar SIEM system to get a real-time analysis of the log data and network flows, aiming to prevent malicious activities. Considerable investments into the solution ensure its flawless performance. But…
Gradually, you get disillusioned in your QRadar deployment, as it suffers from inefficient EPS license capacity utilization, low log data quality and performance, security events omission, misfiring rules, heavy rules and reports. The list is not exhaustive.
Sounds familiar? If so, it’s time for your QRadar system to get a comprehensive health check with QLEAN.
QLEAN is ScienceSoft’s proprietary SOC automation solution to proactively improve SIEM performance and maintenance.
QLEAN major features
We’ve prepared an outline of the top three QLEAN features that make it a valuable QRadar monitoring tool.
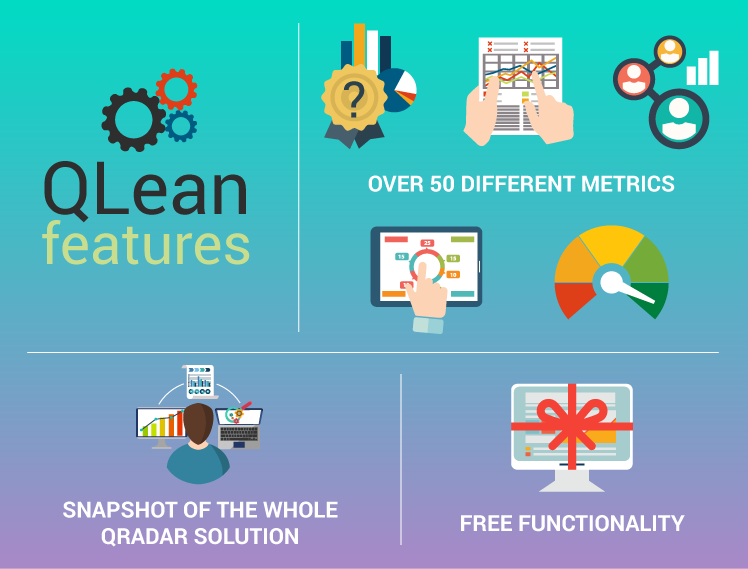
1. Over 50 different statistical and behavioral metrics to assist with QRadar monitoring and SOC operational needs
Let’s take a closer look at selected QLEAN metrics: Data quality (by device type and by log source), Offense Analysis, SOC KPI, Fine-tuning and Performance.
- Data quality.
This metric allows getting an overview of incoming logs completeness and integrity and assists with proper auditing configuration.
Data quality by device type metric allows you to identify problems common to all the servers of the same type. For example, none of your Linux servers supports the event category “User login success”, so you don’t get any data about users’ logins. This reveals an incorrect audit baseline that needs tuning. Issues indicated by Data quality by device type metric allow to see if specific out-of-the-box DSM has to be updated via LogSourceEnhancement or your QRadar deployment needs custom DSM to be developed.
Data quality by log source metric shows problems with particular device instances (log sources). For example, if a certain Windows server can send only one event out of 3,000 supported, it’s a clear sign of incorrect audit of this log source. - Offense analysis.
Offence analysis metric provides you with a quick way to identify and fix rules firing false-positives. QRadar administrators are, probably, familiar with a situation, when some correlation rules constantly trigger false positives creating hundreds of alerts. In practice, such rules are often disabled, which increases network vulnerability. Offense analysis tab in QLEAN UI allows you to identify top 10 rules firing most frequently and see their detailed description – everything you need for a proper rule fine-tuning. Straight from QLEAN UI you may go to QRadar interface to configure the rule and investigate offenses. - SOC KPI.
This metric provides visibility into SOC team involvement in incident response, resolution and tuning actions, which is particularly useful for SOC managers. For example, Incident resolution and Response time charts help to estimate the efficiency of the team as a whole and Incident closed per user chart allows seeing the input of each SOC team member. - Fine-Tuning.
Is the current QRadar fine-tuning effective? How many blank spots in system configuration does our QRadar deployment have? Fine-tuning tab gives you answers to these questions.
See the ratio between untuned and tuned building blocks, untuned network hierarchy entries and correlation rules, custom DSM unknown events, the number of unassigned and assigned log sources to make prompt changes in QRadar configuration. - Performance.
The metric reveals rules, searches, reports and regular expressions' performance gaps. For example, you may check if your QRadar system has the following:- Heavy rules that include irrelevant building blocks.
- Slow searches which process excessive data.
- Reports with the execution time exceeding the established timeframes due to modifications in incoming data amount, QRadar filters or search criteria.
2. A complete snapshot of the whole QRadar solution
QLEAN allows you to analyze historical changes that occurred during the whole period of QRadar operation. For this period, you might have added or removed log sources, changed configuration settings, correlation rules and searchers for reports. Every action has influenced the performance of your SIEM system. With continuous QRadar monitoring, you can assess if the solution has become more efficient. For instance, compare the current performance of QRadar system components and rules, log source statuses, EPS peak value with those which were a year ago.
3. Free functionality with no licensing required and download simplicity
QLEAN’s single-component plug & play architecture allows to download a fully functional solution, which is fast to install, easy to implement, configure and customize. Download a single application (including backend) directly from IBM AppExchange or ScienceSoft website.
QLEAN efficiency in numbers
For those who are used to estimate the value of a product in numbers, here is the accurate statistics on QLEAN efficiency:
- QLEAN is an advanced QRadar SOC automation tool that makes SIEM performance management easy and transparent by automating routine SOC processes and freeing up 30% of admin time to investigate and respond to threats.
- QLEAN provides time and labor savings of about $25,000 per year per average deployment.
- The solution increases QRadar’s efficiency and data quality, which results in lower SIEM/SOC TCO and significantly higher ROI.
So why QRadar monitoring with QLEAN?
Currently, this is the most advanced QRadar health check tool which aims to maximize the value of your SIEM solution, providing a greater degree of SOC automation. If you want to get deeper insights into QLEAN’s capabilities, don't hesitate to reach out: ScienceSoft's SIEM team is always available for a consultation.