Healthcare Supply Chain Analytics
Functionality, Integrations, AI Use Cases, and Costs
ScienceSoft helps healthcare providers turn purchasing, inventory, and supplier data into practical insights that prevent shortages, reduce waste, strengthen cost control, and support better inventory decisions.

Healthcare Supply Chain Analytics in a Nutshell
Healthcare supply chain analytics helps healthcare providers consolidate and analyze data on purchasing, inventory, supplier performance, and clinical demand drivers. Purpose-built analytics solutions improve supply availability for patient-critical items, reduce waste and emergency purchasing, and support better cost control through contract and price variance visibility.
Common integrations for supply chain analytics solutions include SCM, ERP, EHR, and RCM. Most implementations are tailored configurations of proven data platforms (data warehouse or lakehouse) and dashboards (often Power BI or your system’s native reporting), rather than a fully bespoke product build.
The cost of implementing a tailored supply chain analytics solution for a midsize or large healthcare provider typically ranges from $70,000 to $1,000,000+, depending on the number of connected systems, data quality and volume, security and compliance requirements, refresh frequency, and the scope of AI capabilities (if used).
Use our free online calculator to get a cost estimate for your case.
Core Capabilities of Supply Chain Analytics in Healthcare
The features below are the ones ScienceSoft’s healthcare clients ask for most often when building or updating supply chain data analytics. These features are shown as common options, not a standard bundle. The final scope depends on your IT ecosystem, supply chain workflows, and available data.
Spend and contract performance
![]()
Spend intelligence and price variance
Consolidated spend views compare contracted vs. invoiced prices and show price variance by facility, category, and vendor. The view can also flag likely variance drivers such as substitutes, tier changes, and price drifts.
![]()
Contract compliance and leakage control
A contract compliance view keeps off-contract buys from being missed in busy workflows. It compares purchases to negotiated terms and approved catalogs, flags leakage and tier misses, and routes exceptions to buyers with owners and due dates.
![]()
Purchasing workflow and lead-time analytics
Scheduled and ad hoc reports keep purchasing KPIs visible, including purchase order cycle time and supplier delivery time. Procure-to-available timelines highlight where work stalls, like approvals, ordering cadence, supplier lead times, backorders, receiving, or putaway.
Supply assurance and inventory optimization
![]()
Inventory risk and expiration control
Configurable dashboards show inventory on hand across storerooms and clinical areas, with low-stock, stockout, and overstock signals by facility and unit. Expiration views highlight short-dated and slow-moving items, their location and risk status, and what actions are available (e.g., transfer, return, substitute).
![]()
Demand forecasting and surge planning
Forecasting models use historical usage, seasonality and other drivers for demand planning. Teams can test “what if” scenarios (shortages, supplier changes, demand spikes), see projected impact on cost and availability, and get recommended actions such as reorder timing, alternate sourcing, or stocking rules.
![]()
Replenishment parameter proposals
Planners can review system-generated proposals to update par levels, reorder points, and safety stock based on usage patterns and supplier lead time behavior. For that they can use a simple “change proposal” list, with reasons and expected impact. Users can approve, reject, or tune each proposal, then track changes.
![]()
Supplier performance and disruption watchlists
Dashboards track supplier performance (fill rate, on-time delivery, defects, disputes). A disruption watchlist assigns at-risk suppliers and critical items to an owner and tracks follow-up actions. The system can also suggests safer suppliers or backup sources based on recent performance and preferred rules.
Clinical utilization and value analysis
![]()
Utilization and cost by case
Linking supplies to procedures and service lines helps value analysis see which items drive total case cost and where utilization diverges across physicians or sites. Clinical and supply chain stakeholders can review outliers with context (e.g., patient mix, preference items, and kit composition).
![]()
Variation, waste, and substitution analysis
Variation patterns show where kits are overbuilt, items are not used or are substituted, and other waste drivers. Preference-sensitive items (PPI) can be separated from clinically required variation, so value analysis reviews focus on evidence, outcomes context, and supply assurance, not price alone.
![]()
Recall and traceability
For items tracked by lot, serial number, or UDI, traceability links receipt, storage, and use, enabling teams to execute recalls and quarantines quickly and precisely. Supply chain and clinical owners can focus action on affected inventory and cases without broad, manual searches.
![]()
High-cost item and charge integrity
For implants and other high-cost supplies, reconciliation between usage and charging can highlight missed charges, mismatches, and timing gaps. Revenue integrity teams can focus on exceptions, while supply chain uses the same trace to reduce shrink and strengthen chain-of-custody.
Data foundation and controls
![]()
Master data normalization workbench
A data mapping workbench can help data stewards resolve duplicates, unit-of-measure conflicts, and ambiguous identifiers across item, vendor, and location masters. Review queues, unit matching rules, and change history keep normalization decisions consistent and explainable.
![]()
KPI governance and data quality
A KPI catalog can centralize metric definitions and calculation logic, with versioning, reviews and approvals. Data quality rules automatically flag breaks, missing data, latency, and anomalies, and can place them in an issue queue. Analysts can then review the issues, document fixes, and track resolution.
![]()
Security and auditability
Role-based access and optional data masking protect sensitive cost and utilization views from unnecessary exposure. Audit logs track access, exports, and configuration changes so security teams can investigate incidents and governance owners can trace why a number changed.
How AI Supports Decision-Making in Healthcare Supply Chains
ScienceSoft helps healthcare organizations add AI to supply chain analytics to improve forecast accuracy, reduce shortages and waste, and make cost and risk drivers easier to understand. We implement most AI capabilities as human-in-the-loop decision support, so teams can see what data drove each prediction or recommendation, adjust thresholds, and approve actions before they affect purchasing, stocking, or sourcing decisions.
![]()
Predictive AI for demand forecasting and stockout prevention
Predictive models can forecast the demand for supplies by item and location from historical usage, replenishment patterns, lead times, and external signals such as weather and market disruption indicators. They can flag items with high stockout risk, show which inputs drove each forecast shift, and support safer planning for patient-critical categories.
![]()
AI for early shortage warnings and faster response
A risk-scoring AI model can detect early disruption signals such as backorders, allocations, late shipments, and unstable delivery times, then build a ranked shortage watchlist for supply chain review. The watchlist can highlight items most likely to affect care delivery first and show the key signals behind each risk flag, so teams can respond in a consistent way.
![]()
GenAI copilots for supply chain analytics and exception review
An AI copilot can answer common supply chain questions in plain language using only approved dashboards and curated measures (for example, “what changed,” “what drove it,” and “what should be reviewed next”). It can generate short summaries for weekly updates, draft exception review notes, and link each statement back to the underlying dashboard views so decisions remain traceable.
Important Integrations for Supply Chain Analytics
Supply chain analytics relies on data from your current systems, so integrations will depend on your IT landscape and day-to-day workflows. Many organizations start with a few key connections and expand as needs evolve. These patterns reflect the minimum connections needed for procurement, supplier, inventory, utilization, and compliance insights to be trusted and usable.
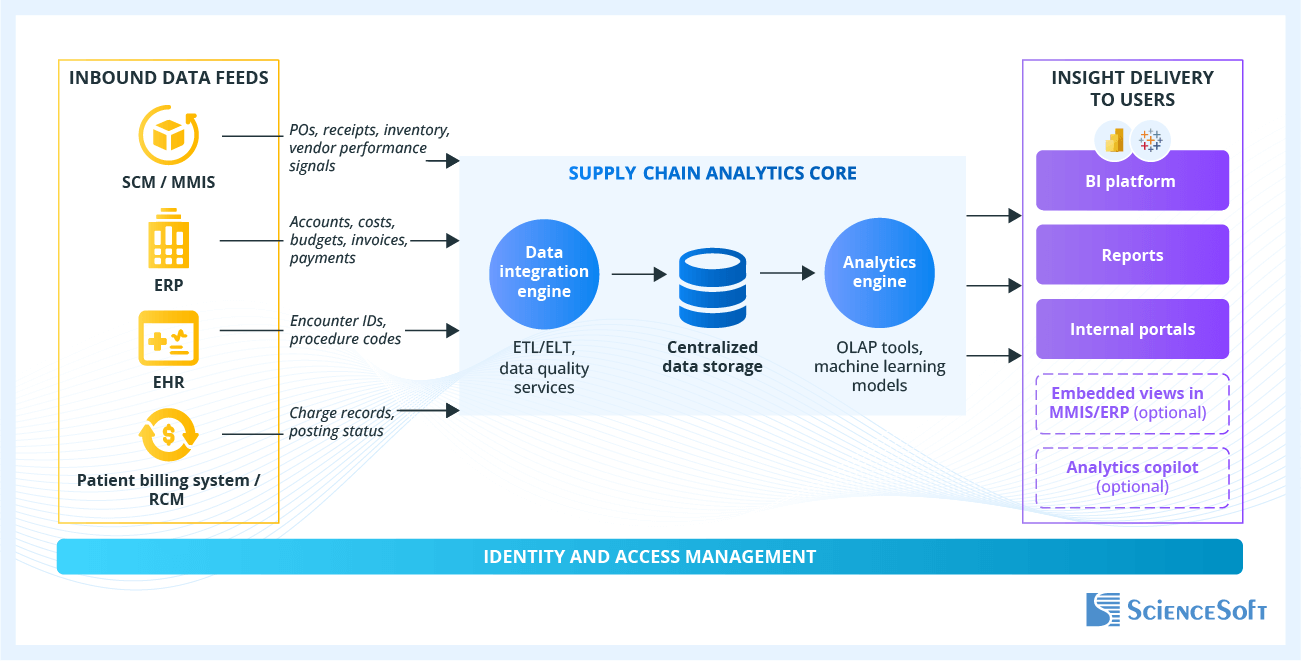
- Supply chain management (SCM) or MMIS software provides purchasing, inventory, and supplier signals used for most supply chain KPIs and exception lists.
- ERP adds cost centers, general ledger mapping, and financial postings to make spend and savings views auditable.
- EHR adds encounter and procedure context so utilization can be analyzed by service line, physician, and case type.
- A patient billing system / RCM connects usage to charges to find missing, late, or inconsistent charging for high-cost supplies.
Users can access analytics insights via BI tools like Power BI or Tableau, scheduled and ad hoc reports, or embedded dashboards in supply chain portals or ERP and MMIS (if necessary).
Development Tips for Supply Chain Analytics in Healthcare
![]()
One shared dataset for all dashboards
Dashboards become unreliable when the same KPI shows different numbers in different reports. This usually happens when each report pulls data separately and applies its own rules. Data analytics architects at ScienceSoft recommend building a single governed semantic layer where key records (orders, receipts, inventory movements) and KPI definitions are modeled once and reused everywhere. This way, even if you change a definition later, it will not cause discrepancies between reports. If a team needs an alternative rule set, it is safer to add a clearly labeled variant metric in the shared layer rather than embedding custom logic inside a single report.
![]()
Integration testing using real-life scenarios
Supply chain data includes edge cases that often break reporting: partial deliveries, backorders, substitutions, returns, and late price updates. If you do not test these early, issues will show up after launch and cause users to stop trusting the numbers. ScienceSoft recommends building a small set of “reference scenarios” and rerunning them after every integration change to confirm KPIs and alerts still behave correctly (for example, a PO that arrives in two shipments, an item that ships as a substitute, a return with a credit, or an invoice priced above contract).
![]()
Dashboard placement
Adoption improves when users can view analytics where they already work: an enterprise BI tool (e.g., Power BI or Tableau), an internal portal, or embedded reporting inside SCM or ERP screens. This decision should be made early because it affects authentication, authorization, sharing, and export controls. BI tools can enforce row-level security and sharing policies at the report layer, while embedded portals often rely on application roles and API access. Regardless of the front end, sensitive cost and utilization datasets benefit from data-level access rules and audit logging so that exports, snapshots, and shared artifacts do not bypass confidentiality requirements.
How Much Does Healthcare Supply Chain Analytics Cost?
Implementation of supply chain analytics in healthcare can cost $70,000–$1,000,000+, depending on integrations, data volume, and AI scope. The ranges below reflect the most common implementation scopes we see across hospitals, health systems, and outpatient provider networks.
![]()
$70,000–$200,000+
We set up a foundation for supply chain reporting. This means integrating data from 1–2 core systems (typically MMIS/SCM or ERP), normalizing item, vendor, and location basics, and delivering 6–10 configurable dashboards for spend, contract compliance, and inventory risk.
![]()
$400,000–$1,000,000+
We implement an enterprise-grade analytics program for multi-facility organizations with complex catalogs and workflows. This means integrating 6–12+ data feeds, supporting cross-facility normalization and benchmarking, and delivering 18–30 dashboards with configurable worklists and performance tuning for large volumes.
![]()
$60,000–$200,000+
We add market-available machine learning models for demand forecasting, stockout prediction, or anomaly detection, and add a governed copilot that can understand natural-language queries, explain issue root causes, or suggest next-best actions for human review.
Want a more precise figure?
ScienceSoft's team is ready to provide a quote for your specific case.
Our Clients Say


When we first contacted ScienceSoft, we needed expert advice on the creation of the centralized analytical solution to achieve company-wide transparent analytics and reporting. <…> ScienceSoft’s team members proved to be extremely flexible and responsive.

bioAffinity Technologies hired ScienceSoft to help in the development of its automated data analysis software. <…> In addition to the solid technical expertise shown by ScienceSoft, its developers demonstrated a profound understanding of laboratory software specifics and integrations.

They collaborated with our medical professionals with great professionalism and care, respecting the research environment and its unique challenges. We found ScienceSoft to be dependable and forward-thinking, and we would confidently recommend them for high-responsibility projects.


With ScienceSoft, we got exactly what we needed. <…> It was a pleasure working with them. ScienceSoft’s team is thoughtful, proactive, and well-rounded in healthcare specifics.
Why Build Your Healthcare Supply Chain Analytics With ScienceSoft
- Since 2005 in healthcare software engineering and analytics consulting.
- Since 1989 in data analytics and AI.
- 150+ successful healthcare IT projects.
- Architecture and Solutions CoE with 20+ senior architects to design integration-first enterprise analytics platforms.
- In-house HIMSS-certified consultants and compliance officers to guarantee software alignment with the healthcare organization’s internal processes and regulations such as HIPAA, GDPR, and PDPL.
Certifications and awards
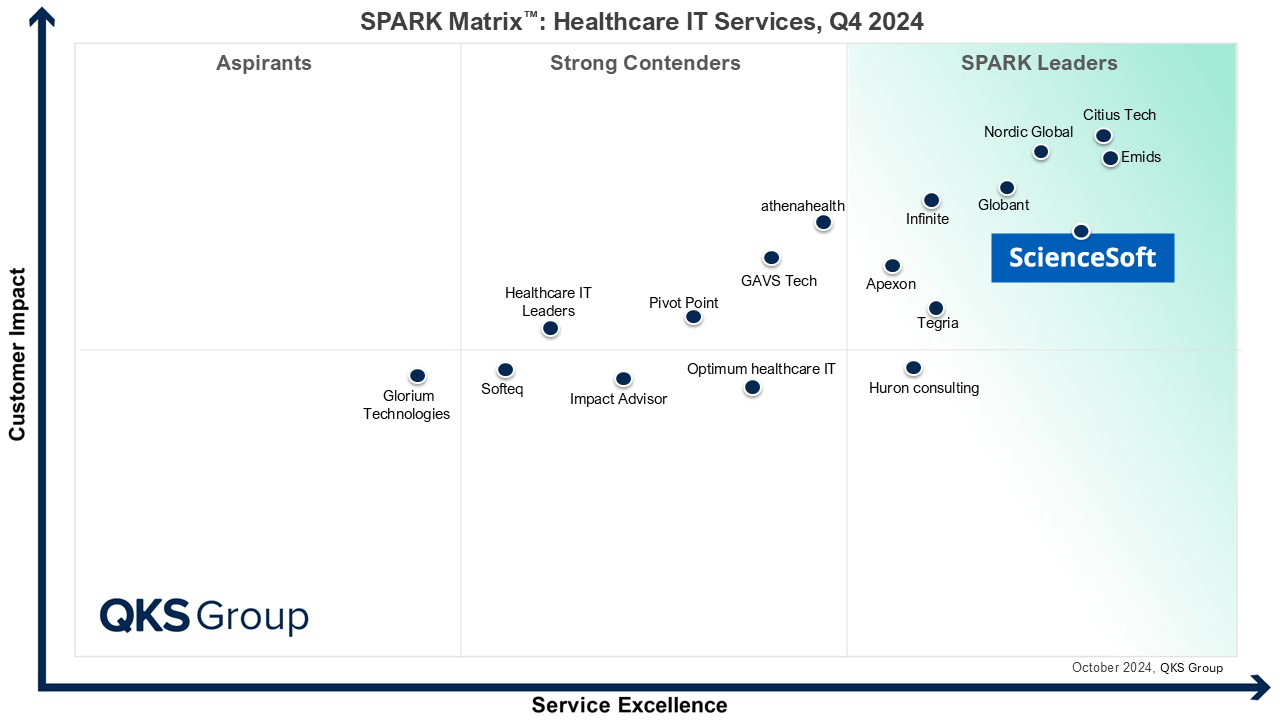
Featured among Healthcare IT Services Leaders in the 2022 and 2024 SPARK Matrix

Microsoft Solutions Partner for Data & AI
Named among America’s Fastest-Growing Companies by Financial Times, 5 years in a row

Recognized for Healthcare Technology Leadership by Frost & Sullivan in 2023 and 2025

Four-time finalist across HTN Awards programs

Top Healthcare IT Developer and Advisor by Black Book™ survey 2023
HIMSS Gold member advancing digital healthcare

ISO 13485-certified quality management system

ISO 27001-certified security management system
