Analytics for Medical Labs
Features, Integrations, and Costs
In data analytics since 1989 and in healthcare IT since 2005, ScienceSoft builds secure and compliant analytics solutions to help clinical, R&D, public health, and other medical labs get data-driven insights into test results, operational and financial planning, quality control, and more.
Laboratory data analytics provides a consolidated view of disparate data from LIMS/LIS, EHR/EMR, ERP or financial systems, inventory management solutions, and other systems used by laboratories. It helps to optimize testing protocols, inventory management, staffing, and other aspects of lab management. Advanced lab analytics systems, including custom solutions, feature capabilities for ML/AI-powered medical image analysis, test result analysis, and scenario modeling (e.g., to simulate patterns of workload distribution).
- Implementation time: 2–6 months for an MVP.
- Costs: $30,000–$500,000, depending on the solution's complexity. Use our free online calculator to get a ballpark estimate for your case.
- Core integrations: a laboratory information management system (LIMS) or a laboratory information system (LIS), an EHR or EMR, a laboratory inventory management system, medical lab billing software, an ERP or financial management software, asset management software.
Data Analytics is Among Top Three IT Priorities for Laboratories
According to 2025 State of the Industry Report by Medical Laboratory Observer, data analytics optimization to support lab management is among the major IT investments for labs alongside infrastructure development and new LIS implementation. More than 60% of the survey respondents report willing to implement or expand their analytics in the near future.
Analytics for Laboratories: High-Demand Features
Essential System Integrations for Lab Analytics
According to the 2025 State of the Industry Report by Medical Laboratory Observer, nearly half of the surveyed professionals report integration and interoperability issues as the biggest obstacle to automating the processes at their labs.
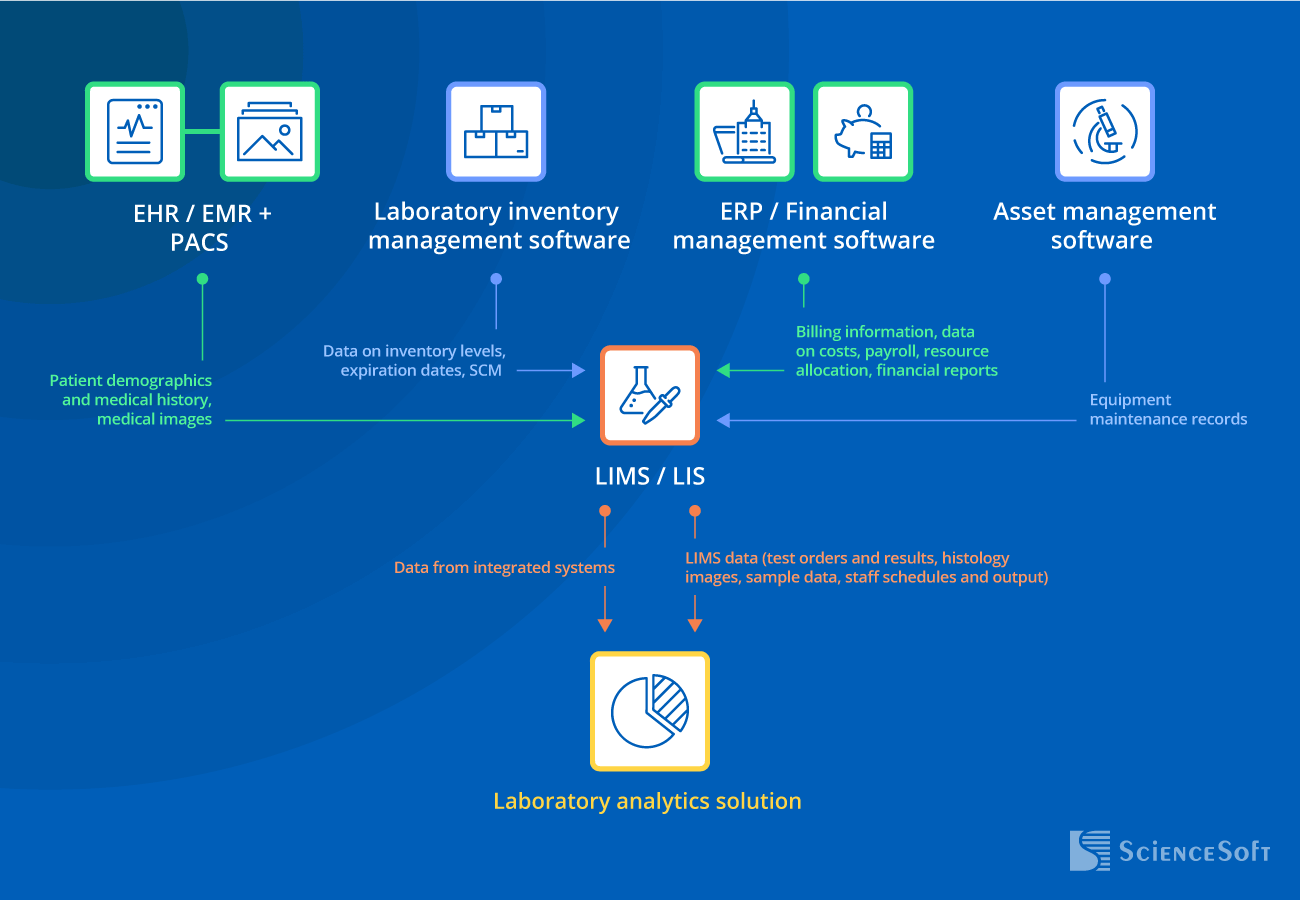
Below, ScienceSoft’s consultants provide a sample integration pattern that can be used in most labs, where a LIMS/LIS consolidates data from enterprise systems and serves as a major data source for a laboratory analytics solution.

- EHR or EMR + PACS — to get insights for context-driven interpretation of test results; to identify patterns specific to certain patient groups and support clinical decision-making.
- Laboratory inventory management software — to optimize inventory levels, avoid over/under-stocking, and prevent reagent and consumables waste; to forecast inventory needs; to optimize logistics operations.
- ERP or financial management software (e.g., medical lab billing software, revenue cycle management software) – to support informed budget planning; to find cost-optimization opportunities.
- Laboratory information management system (LIMS) or laboratory information system — to get insights for optimizing testing protocols and increasing sample processing efficiency; to balance personnel workload; to forecast staffing needs and analyze employee efficiency.
- Asset management software — to enable predictive equipment maintenance.
Lab Analytics Development: Key Steps and Industry Best Practices
Laboratory analytics development is the process of delivering tailored or highly specific software capabilities that are not offered by OOTB solutions (e.g., role-centric data views, integrations with custom and legacy systems, ML/AI-powered features). Drawing on 36 years of experience in implementing custom analytics solutions, ScienceSoft summarizes the key steps and best practices to develop analytics for labs.
1.
Business analysis and requirement engineering
At this stage, business analysts conduct interviews with lab managers, clinical staff, IT team representatives, and other stakeholders to elicit the organization’s business goals and understand data- and business-related processes (e.g., types of data and data sources; operational specifics). This information is then translated into business and software requirements. The business analyst and a compliance consultant or an SME on the laboratory’s side determine the applicable regulations and compliance requirements for the solution-to-be (e.g., HIPAA, GDPR, FDA regulations, ISO 15189).
2.
Technical design
At this step, a solution architect decides on the integrations, architecture components, and techs to support lab data analysis.
Depending on the case, the architect may choose one of the available platforms to optimize development time and costs. For example, Azure Synapse Analytics features a flexible integration tool (Azure Data Factory), which makes the platform a good choice for labs that need to integrate data from multiple disparate sources (e.g., when performing clinical trials). Labs that conduct genomic research are likely to benefit from Amazon Redshift due to its columnar storage and advanced compression mechanisms. It offers an optimal cost-to-benefit ratio for storing vast data sets and processing complex analytics queries.
Working with healthcare data, we pay special attention to building data processing pipelines that ensure standardized representation of different nomenclatures in accordance with the required coding systems like SNOMED CT, LOINC, ICD-10, CPT, CDT. Consistent names and codes result in more accurate analysis and dependable insights. This is especially important for labs as the same test can have different names depending on the system it arrives from (e.g., variations such as CBC vs. complete blood count vs. hemogram).
3.
UX/UI design
UX/UI designers create user personas and user journeys to tailor the UI according to specific user roles. For example, researchers and lab technicians may need dashboards with clickable visuals and multi-parameter data segmentation. On the other hand, lab administrators are likely to need more static interfaces, e.g., templates for creating weekly performance reports.
When implementing an analytics solution, user adoption often turns out to be a major challenge. To facilitate the user adoption of a new solution, we build convenient UIs that ensure a short learning curve and smooth navigation. For example, we study the interface of software the client already uses and replicate elements like colors, widgets, and tools in the new solution.
4.
Development, QA, and deployment
At ScienceSoft, we typically recommend conducting testing in parallel with production to ensure efficient collaboration between development and QA teams and prevent issues at early development stages. We also advise implementing best practices for optimizing development time and costs. That includes the implementation of CI/CD pipelines and DevOps practices, utilizing ready-made third-party components (e.g., for data integration, workflow automation), and going for feasible QA automation. According to our experience, this approach helps cut development costs by up to 78%.
How Much Does It Cost to Develop a Laboratory Analytics Solution?
The cost of laboratory analytics development may range from $30,000 to $500,000. The major cost factors include the range of operations a lab wants to analyze (e.g., inventory management and pathology will require dedicated data sources and data models) and the complexity of analytics features (e.g., rule-based or ML/AI-powered forecasts, real-time analytics driven by big data).
|
|
Basic solution |
Medium-complexity solution |
Advanced solution |
|---|---|---|---|
|
The number of business areas to be covered by analytics
?
For example, pathology, inventory management, finance, and quality assurance. |
1 business area |
2–3 business areas |
4+ business areas |
|
Integration complexity
?
More data sources lead to greater data format diversity and additional data standardization efforts. Legacy and custom-built systems may require custom API development. |
Integration with 1–2 core systems (e.g., a standalone LIMS/LIS, inventory management software). |
Up to 7 data sources, including several LIMS/LIS. |
Integration with all the required internal and external systems, including same-type systems of different organization divisions. |
|
Data complexity
|
Structured (e.g., relational databases, CSV, Parquet files). |
Structured and semi-structured (e.g., XML, JSON, ORC files). |
Structured, semi-structured, and unstructured (e.g., DICOM, PDF, HTML files). |
|
Data processing frequency
|
Batch (e.g., every 24 hours). |
Batch and real-time. |
Batch and real-time. |
|
Complexity of analytics features
|
KPI calculation, data segmentation, rule-based forecasting (e.g., forecasting sample processing time based on the previously calculated average time). |
|
|
|
Reporting and visualization
|
Via market-available tools like Power BI, Tableau, Looker. |
Via market-available tools like Power BI, Tableau, Looker. |
|
|
Costs
|
$30,000 – $70,000 |
$70,000 – $150,000 |
$150,000 – $500,000 |
Achieve Cost-Optimized Operations and Boost Profitability With Data-Driven Insights
Since 1989 in data analytics and 150+ successful healthcare IT projects, ScienceSoft has the necessary expertise to build an efficient lab analytics solution. Holding ISO 9001- and ISO 27001 certifications, we can guarantee top software quality and complete security of your data.


