Healthcare Data Analytics
Software Solutions, Costs, Outcomes
Since 1989 in data analytics and since 2005 in healthcare IT, ScienceSoft builds custom and platform-based analytics software that streamlines clinical decision-making, optimizes operations and costs, and enables care personalization.

Contributors

Healthcare IT & AI Consultant

Principal Architect, AI & Data Management Expert, ScienceSoft
Healthcare Data Analytics: the Essence
Healthcare analytics is needed to consolidate and analyze multi-source data related to patient health, clinical processes, and healthcare business operations. Specialized healthcare analytics solutions help improve health outcomes, promote value-based care, support clinical decisioning, and achieve higher business process efficiency.
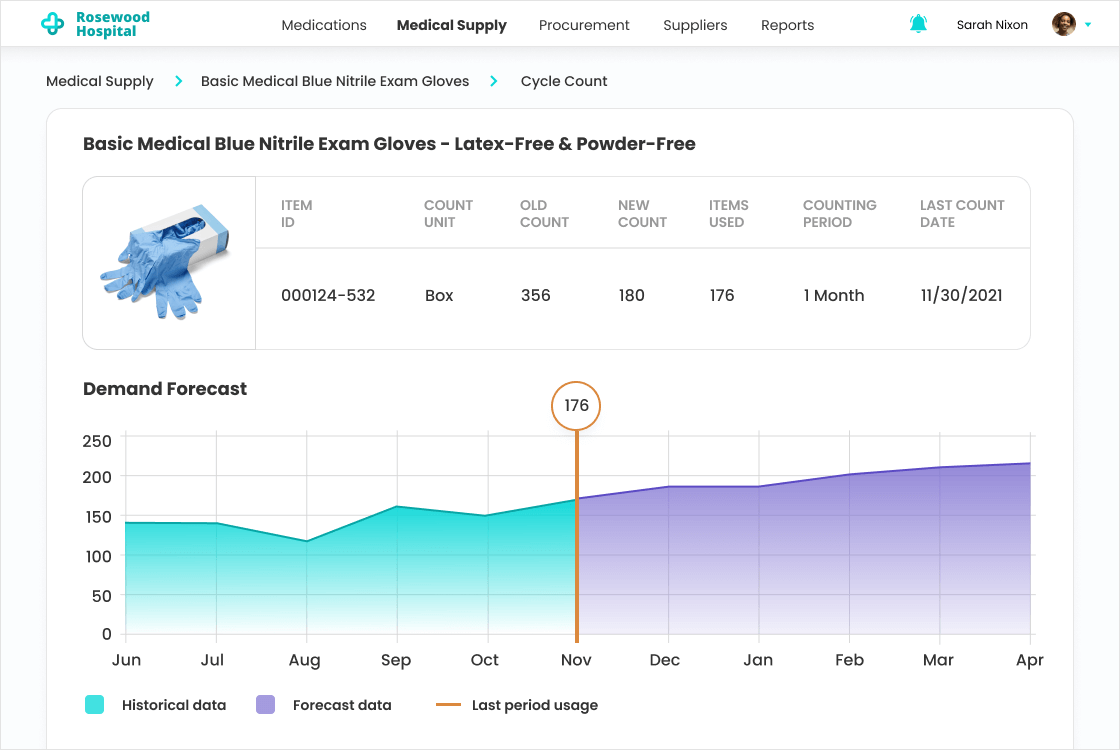
Modern healthcare analytics goes beyond retrospective reporting. AI-enabled analytics can help healthcare organizations forecast patient flow and occupancy, identify patients with elevated deterioration risk, and automate clinical workflows. To support daily decision-making, it can provide role-specific alerts, risk scores, and recommended actions in real time.
- Integrations: EHR/EMR, healthcare CRM, patient portals and apps, remote patient monitoring software, medical image analysis software, healthcare asset tracking software, and more.
- Implementation costs: $100,000–$1,250,000, depending on the number of integrated sources, data complexity, compliance requirements, AI/ML-powered analytics, and more. You are welcome to use our cost calculator to get a tailored ballpark estimate for your project.
- ROI: up to 350%.
Check the Examples of Insights You Can Get with Healthcare Analytics
Healthcare Analytics Software: Key Features
Below, ScienceSoft’s consultants list the key analytics software capabilities most requested by our clients in the healthcare domain.
General analytics features
![]()
Healthcare data processing & storage
- Automated ingestion of structured and unstructured data from various sources (e.g., ERP, CRM, patient portals).
- Cost-optimized storage of raw data in a data lake.
- Batch and real-time healthcare data processing.
- A healthcare data warehouse for analytics querying and reporting.
- Automated data governance and data quality management.
- Data storage, transfer, and access mechanisms compliant with the required regulatory standards (e.g., HIPAA, GDPR).
![]()
Core analytics and reporting
- Data visualization via customizable dashboards and self-service reports.
- Automated KPI calculation (e.g., HCAHPS, ALOS, readmission rate).
- Automated data segmentation (e.g., by patient demographics, health outcomes).
- Continuous KPI and patient state monitoring.
- Instant notifications and alerts (e.g., on fraud detection, changes in patient vitals).
- Identifying trends, dependencies, and issue root causes in the healthcare data.
- Forecasting future health outcomes and trends.
Specific healthcare analytics features
![]()
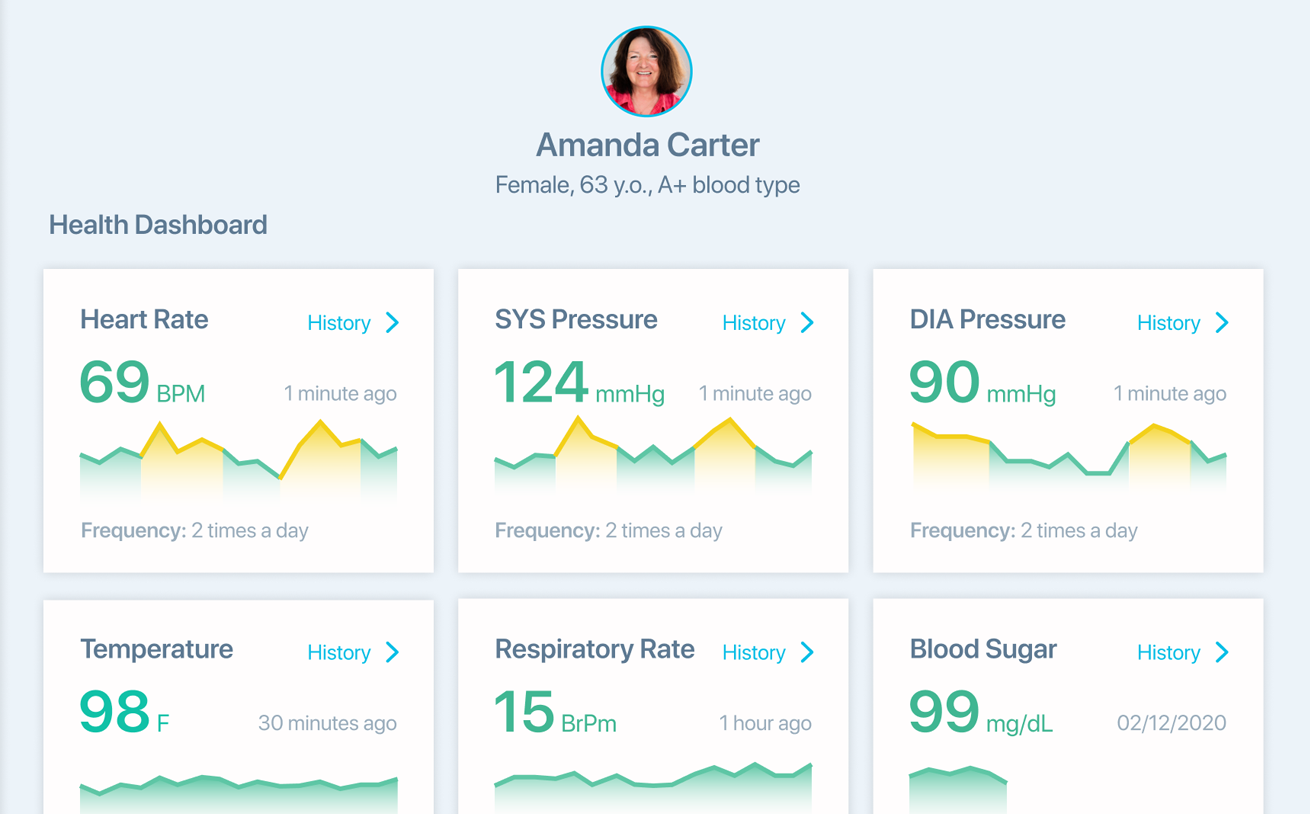
Patient-generated health data (PGHD) analytics
- Patient data analysis, including demographic data, clinical data, and patient history.
- Continuous monitoring of PGHD collected from wearables, sensors, patient apps, daily rounds, etc.
- Notifications & alerts on changes in a patient’s state (e.g., abnormal vitals).
- Identifying trends and dependencies between treatment-related activities, lifestyle changes, and patients’ vital parameters.
![]()
Health outcomes analytics
- Automated calculation of health outcomes KPIs, including mortality rates, readmission rates, HRQoL, PROs, and more.
- Automated segmentation of outcomes by demographic factors, physician, facility, condition, etc.
- Identifying trends and dependencies between health outcomes and treatment types, medications, length of stay, and other possible variables.
- Forecasting possible health outcomes (e.g., readmissions, patient volume, high-risk patients).
![]()
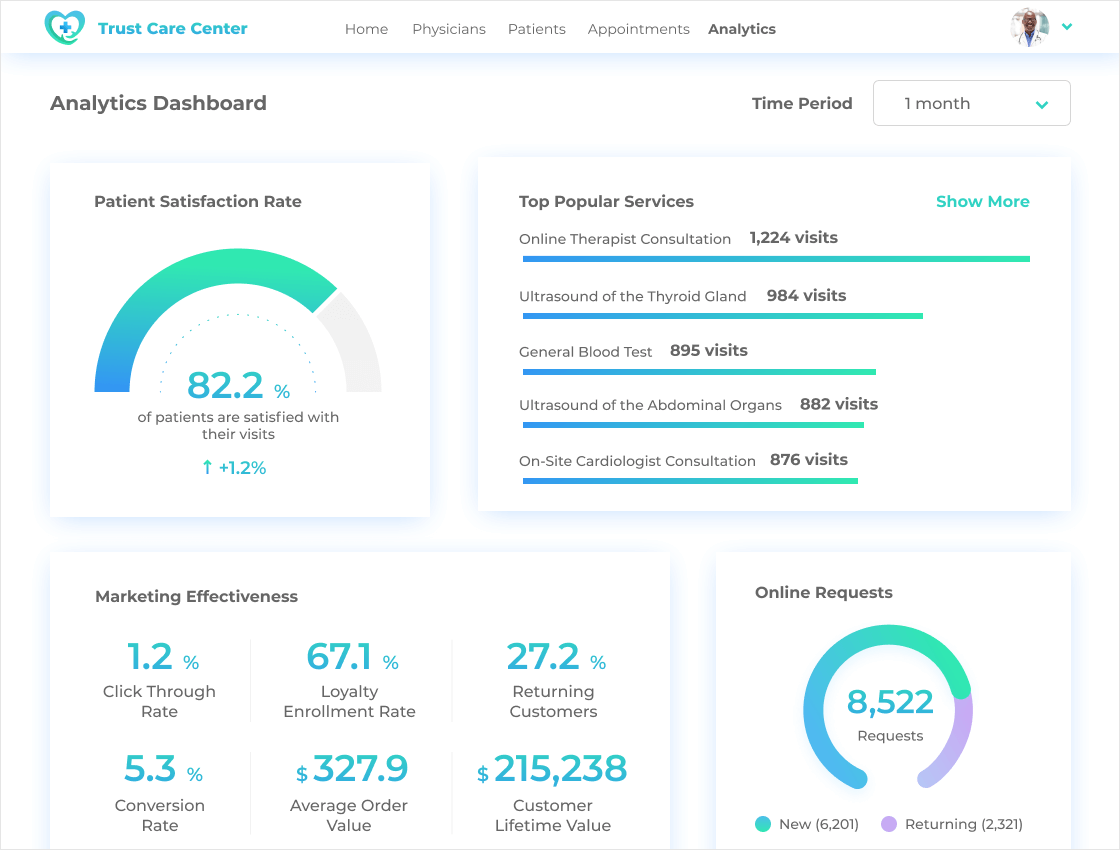
- Automatic calculation of facilities and care KPIs (e.g., ER waiting time, bed occupancy rate, patient satisfaction scores).
- Equipment KPIs (e.g., asset utilization rate, lifespan).
- Pharmaceuticals KPIs (e.g., medication adherence rate, inventory turnover rate).
- Laboratory KPIs (e.g., turnaround time, cost per test, volume of unnecessary tests).
- Personnel KPIs (e.g., nurse-to-patient ratio, patient load, turnover rate).
- Supply chain management KPIs (e.g., supplier performance, stock-out rate, order accuracy).
- Identification of operational bottlenecks (e.g., long patient wait time, delayed prescription processing) and root cause detection.
- Prediction of demand for specific services and resources (e.g., equipment, surgical facilities, medications, staff).
![]()
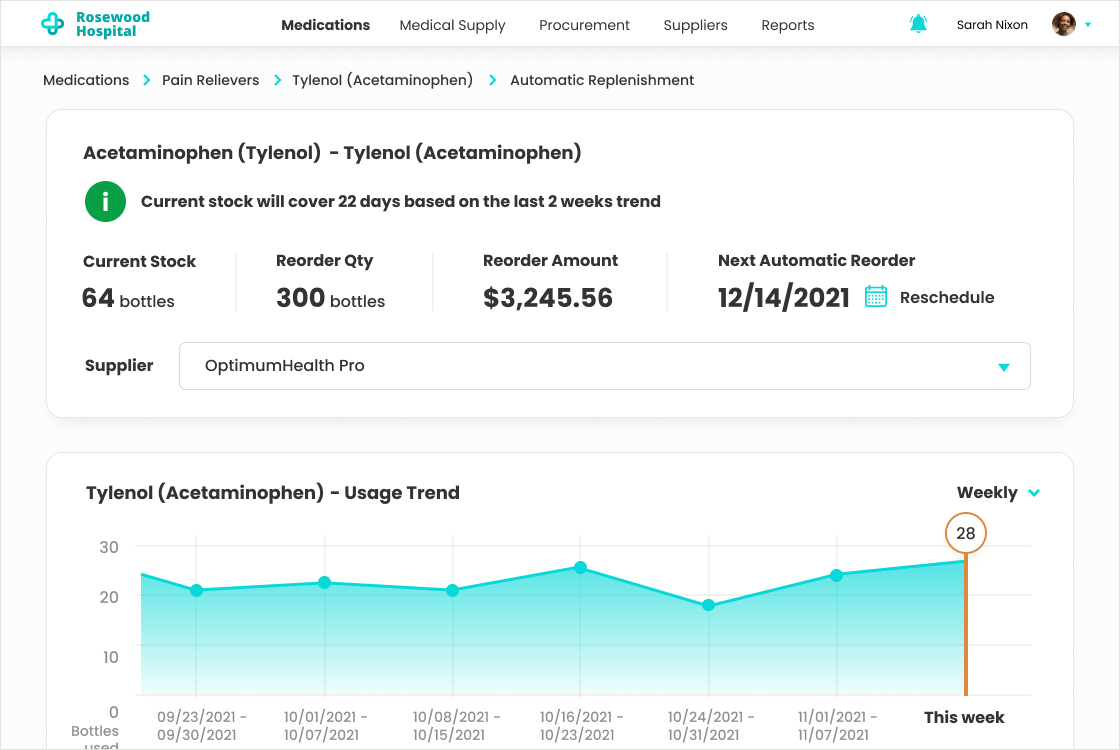
Costs and finance analytics
- Continuous monitoring and analytics of the cash flow and treatment expenses, including care delivery and overhead costs.
- Automated segmentation of costs (per episode, condition, patient group), outstanding payments (e.g., per department, facility), actual ROI by the type of investments.
- Notifications & alerts on due and overdue payments, potential payment or insurance fraud.
- Identifying trends and dependencies between costs and operational processes, reimbursement policies, and health outcomes.
- Forecasting of future costs per period, expense type, etc.
- Predictive modeling to identify the financial impact of planned actions (e.g., changes in reimbursement policies, supplier change).
- Smart recommendations on cost-saving opportunities and pricing optimization without negatively affecting health outcomes.
![]()
- Alerts on potential health risks and complications (e.g., allergies, drug interactions, adverse effects).
- Diagnostic assistance (clinical decision trees, differential rankings of potential diagnoses based on patient data).
- Laboratory findings analysis.
- Clinical guidelines adherence checks and alerts.
- CDS for medical specialties (tailored decision support for dermatology, ophthalmology, cardiology, etc.) and interdisciplinary collaboration support for complex cases.
![]()
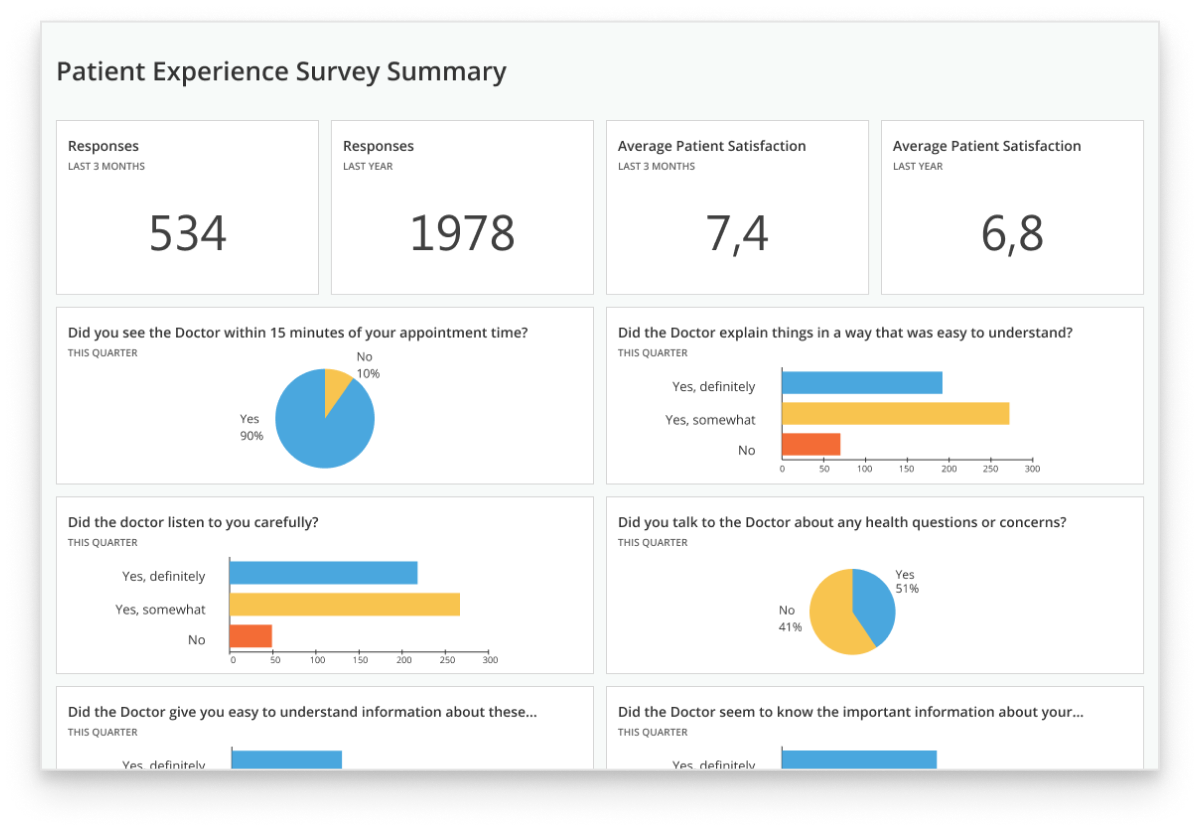
Patient engagement analytics
- Automated calculation of patient engagement KPIs, including patient dropout and portal engagement rates, patient loyalty, etc.
- Identifying trends and dependencies between engagement levels and various dimensions (e.g., facilities, therapeutic departments, disease statuses, age); engagement levels and engagement activities (e.g., follow-up calls, preventive screening reminders).
- Smart recommendations on improving patient engagement rates.
AI & ML capabilities
![]()
Data ingestion and interpretation
- Speech, text, and image recognition to streamline data input and structuring.
- Medical image analysis.
- Anomaly detection to surface unexpected clinical, operational, or financial patterns.
- Predictive intelligence.
![]()
Data generation
- Clinical documentation (reports, visit summaries, notes, etc.).
- Patient-facing content (instructions, answers to FAQs, etc.)
- Smart recommendations (e.g., to personalize treatment, optimize resources, choose engagement tactics).
- Synthetic datasets for anonymized research and model training.
- Scenario simulation.
Healthcare analytics solutions with clinical decision support features may qualify as Software as a Medical Device (SaMD). This may apply to software that interprets medical images or test results with AI, sends patient state alerts for potential clinical intervention, or enables remote control over connected medical devices. In such cases, the solution should be designed in line with IEC 62304:2006/Amd 1:2015, ISO 13485, and FDA requirements. ScienceSoft invests heavily in our expertise with the above standards and can involve compliance experts to support the design and validation of such tools.
4 Types of Healthcare Analytics
When implementing healthcare analytics software, ScienceSoft differentiates between the following four types of analytics. Simpler systems may only enable one or two of them, while the most advanced solutions often combine all four.
Descriptive
Analyzes historical data to say what happened. For instance, to calculate the average ER wait time for the last month.
Diagnostic
Uses historical data and statistical analytics techniques to explain why things happened. For instance, why the average ER wait time was higher than usual last month.
Predictive
Applies AI/ML capabilities to historical data and builds what-if scenarios to predict what will happen. For instance, how high the average wait time will be next month.
Prescriptive
Uses AI/ML capabilities to recommend what to do to avoid an unfavorable prediction and achieve better results. For instance, how to reallocate stuff to avoid high ER wait times.
Essential Integrations for a Healthcare Data Analytics Solution
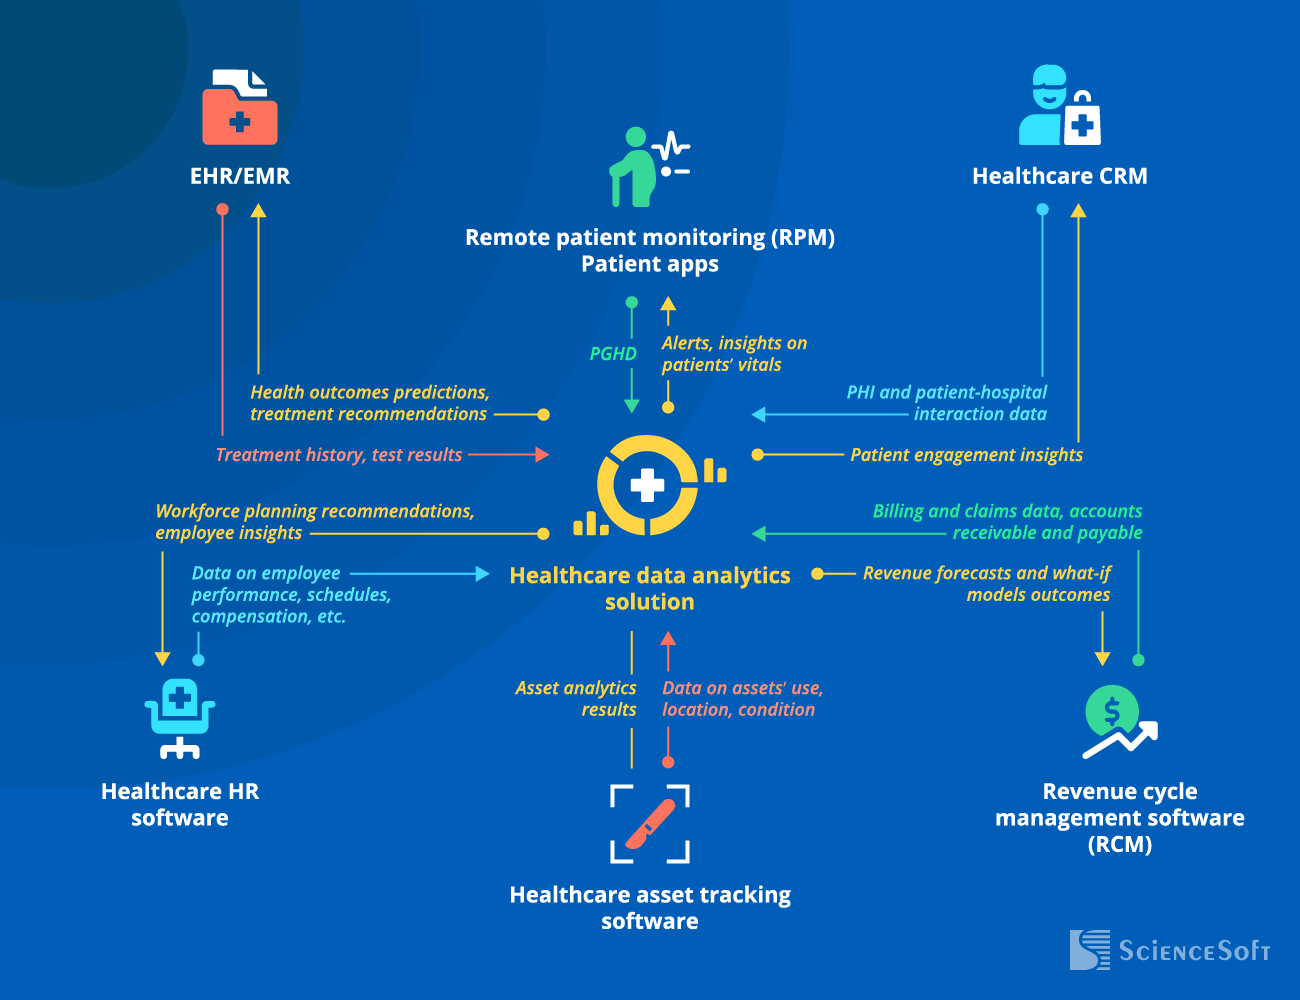
To support clinical decision-making (e.g., by facilitating diagnosing or suggesting the most effective treatment option).
- To enable efficient patient segmentation and targeting.
- To identify best practices and service gaps.
Note: Alternatively, your healthcare analytics solution can be integrated with call center software.
- To enable continuous monitoring and analytics of the patients’ vitals with immediate alerts in case of abnormal readings.
- To ensure personalized care or patient management depending on a particular condition or goal.
- To optimize employee engagement and retention strategies and ensure proper staff credentialing.
- To shape and improve initiatives for employee performance optimization.
- To ensure smooth scheduling.
- To enable billing and financial management optimization and increase revenue.
- To ensure automatic detection of fraudulent claims.
- To optimize asset utilization and minimize related losses (e.g., due to missed opportunities for reuse or incorrect storage conditions).
- To improve inventory management.
- To enable efficient medication distribution control and decrease medication shortage risks.
- To plan timely equipment maintenance.
Multiple EHR-adjacent software systems (e.g., practice management, LIS, HIE) can communicate with the analytics module via the integrated EHR or directly via APIs. In each specific case, we design a custom integration architecture based on our clients’ unique IT infrastructure to deliver the most efficient solution.
Why Healthcare Organizations Choose ScienceSoft
|
|
Multi-source healthcare data integration ScienceSoft consolidates clinical, financial, operational, and patient-generated data into a reliable analytics environment. We help clean, standardize, and structure healthcare data so that teams can work with consistent metrics instead of reconciling conflicting reports. |
|
|
EHR data preparation for analytics EHR data can be difficult to prepare for analytics due to complex structures, inconsistent fields, and organization-specific documentation practices. ScienceSoft designs practical data pipelines, reusable data models, and ready-to-use reporting layers to help healthcare teams start generating meaningful insights without months of manual setup. |
|
|
Analytics beyond dashboards ScienceSoft can support healthcare organizations at every analytics maturity stage, from descriptive dashboards and operational reports to predictive models, risk scoring, care gap detection, and AI-assisted recommendations. We design analytics to help teams understand not only what happened, but what should be checked, prioritized, or acted on next. |
|
|
Alignment between technical and business stakeholders Healthcare analytics initiatives involve many stakeholders, including IT teams, data analysts, clinicians, operations leaders, finance teams, and compliance specialists. ScienceSoft helps align their expectations, translate business and clinical needs into analytics requirements, and design reporting logic that is clear to both technical and non-technical users. |
|
|
Healthcare-specific metrics and reporting logic ScienceSoft designs analytics solutions around healthcare data standards, compliance requirements, and domain-specific metrics, including readmission rates, length of stay, care gaps, utilization, denial trends, quality measures, patient outcomes, and resource use. This helps clients avoid generic dashboards that look polished but do not answer healthcare-specific questions. |
|
|
Workflow-based analytics design ScienceSoft focuses on how insights will be used in daily work: by care teams prioritizing patients, operations managers planning staffing and capacity, finance teams tracking reimbursement risks, and executives monitoring performance. We can embed analytics into existing workflows, automate recurring reports, and tailor dashboards to the decisions each role needs to make. |
How ScienceSoft Drives Value of Healthcare Analytics Solutions
We follow our established practices for scoping, cost estimation, risk mitigation, and other project management aspects to reach project goals regardless of time, budget, and change request constraints.

Tailored functionality
With off-the-shelf software, you often have to settle for standard functions that don’t fit your processes, or pay for fancy features you don’t need. Focused on bringing value with our services, we plan and implement efficient software that answers the specific needs of our clients.
Mature Agile culture
Relying on mature Agile processes established over decades of practical experience, we can deliver an analytics system MVP in 2–6 months and gradually upgrade it to the fully-featured solution in stable 2–4-week iterations.
Cost optimization
To optimize software development costs, our developers use proven third-party components, open-source APIs, and microservices that enable significant code reuse. Our established DevOps practices, efficient CI/CD design, and feasible QA automation help us reduce the total development cost by up to 78%.
Focus on security and compliance
Proud of having zero security breaches in our 37-year history, we keep investing in our ISO 27001-certified security management system. With a team of in-house security engineers and regulatory consultants, including HIMSS-certified experts, we can guarantee full software compliance with HIPAA, GDPR, FDA requirements, and more.
Complex analytics
In data science since 1989, we enhance analytics solutions with AI capabilities that power intelligent automation and forecasting. We also apply a decade of experience in big data to ensure accurate and timely analytics across massive data sets.
Costs and Benefits of Healthcare Data Analytics Implementation
The cost of healthcare analytics may vary from $100,000 to $1,250,000, depending on data complexity and diversity, the number of integrations, the presence of AI/ML analytics capabilities, and more.
![]()
$100,000–$250,000
A basic solution that:
- Integrates with 1-3 key data sources, like EHR or CRM.
- Enables batch data processing (e.g., once every 24 hours).
- Calculates the essential operational and financial KPIs.
- Identifies trends and dependencies in health and operational data.
![]()
$250,000–$500,000
A solution of medium complexity that:
- Integrates with multiple internal sources (e.g., RMS, asset tracking software, HR software).
- Enables batch and real-time analytics.
- Enables root-cause analysis, patient and outcomes segmentation, and forecasting.
- Provides rule-based and ML-powered analytics.
![]()
$500,000–$1,250,000
An advanced solution that:
- Integrates with any number of internal and external sources, including unlimited patient apps and IoT devices.
- Integrates with several same-type sources, e.g., two CRMs of different divisions.
- Enables batch and real-time analytics, including big data processing.
- Enables complex analytics, including AI-powered predictions and recommendations.
Want a more precise figure?
Our consultants will provide a tailored cost estimate for your data analytics initiative.
*Software license fees are not included.
![]()
87% of Organizations Report Measurable Business Value from Their Data Analytics Investments
The 2024 Data and AI Leadership Executive Survey is based on feedback from over 100 global industry leaders that have implemented data analytics solutions. The report features 10+ prominent organizations from the healthcare domain, including Pfizer, Mayo Clinic, UCLA Health, and more.
Market-Available vs. Custom Healthcare Analytics Software
When searching for out-of-the-box solutions, you’ll find several platforms that offer ready-made products for different types of analytics (e.g., for patient outcomes, revenue cycle tracking). Although these products can be customized or integrated into one with the help of native APIs, the capabilities of such software are still limited to a predefined set of features. If you are looking for a comprehensive system covering several analytics types at once (e.g., finance, operations, asset tracking) or a highly precise tool for a medical specialty (e.g., CDS for oncology), you’re likely to find OOTB solutions insufficient.
On the other hand, custom software means you’re getting a tailored solution that meets all your analytics needs and fits your unique IT environment. The downsides of custom software are related to substantial initial investments and relatively lengthy implementation. However, such solutions drive up to 350% ROI with an average payback period of 9 months, which makes the investments worthwhile in the long run.
The high ROI of custom solutions is driven by:
- A bespoke feature set with any level of analytics complexity (e.g., multi-dimensional patient segmentation, financial analytics across different taxation systems).
- Smooth integration with all the required systems: back-office and legacy software, third-party platforms (e.g., a clearinghouse), IoT devices, and more.
- Compliance with the required global or local regulations (e.g., HIPAA, FDA, ADHICS), convenient functionality for compliance checks and reporting.
- Guaranteed scalability in case of user and data volume increase.
- Tailored interfaces for different user groups (e.g., hospital administrators, physicians, MLSs), leading to increased convenience and higher productivity.
Build Your Healthcare Data Analytics Solution with Experts

Consulting on healthcare analytics
Whether you’re building a new analytics solution or upgrading your existing systems, we’re ready to provide strategic assistance. Our consultants will design a scalable architecture and choose an optimal tech stack for your initiative, ensure full solution compliance and security, and help avoid unnecessary risks when planning the project.

Implementation of healthcare analytics
We build secure, efficient, and user-friendly analytics solutions that are easy to support and upgrade with new features in the long run. We also provide comprehensive software documentation to streamline compliance checks and maintenance and can deliver long-term support services or training for your team.
About ScienceSoft
ScienceSoft is an IT consulting and software development company headquartered in McKinney, Texas. Since 2005, we have been helping healthcare organizations leverage the potential of advanced data analytics to deliver better care, improve health outcomes, and achieve better operational efficiency. Our mission is to drive your project success in spite of time and budget constraints, as well as changing requirements. Being ISO 13485, ISO 9001, and ISO 27001-certified, we can guarantee top software quality and complete security of our clients’ data.
