A Guide To Measuring Patient Engagement


Related topics:
Last updated:
The role of patients in healthcare is evolving. They are no longer just following instructions — they want to be treated as essential members of the healthcare team and to be actively involved in their care journey. They also want easy access to their medical information at any time they need it.
According to statistics from the Centers for Disease Control and Prevention (CDC), over 58% of adults use the internet to research medical information, and 41.5% communicate with their doctor online, indicating a growing desire for active engagement in their care.
Patient engagement is associated with numerous benefits. According to the WHO, patient engagement is one of the key strategies for improving patient safety. Among other benefits, research shows that engaged patients tend to have better health outcomes, lower hospitalization rates (12.5% decrease), shorter hospital stays (0.4 days decrease), lower readmission rates (4.2% decrease), and lower medical costs (5.3% decrease). Such patients are also, in general, more satisfied with their care.
Providers can also get direct benefits when their patients are actively involved in care. Digital engagement is a powerful predictor of patient loyalty. According to Accenture, nearly 80% of highly digital patients are most likely to stay with their providers.
But how do we know if patients are truly engaged?
In this guide, we’ll explore why measuring patient engagement matters, how it can be measured, and how digital tools, such as mobile apps and patient portals, can help.
How To Measure Patient Engagement
There is no single perfect tool for measuring patient engagement. To gain a comprehensive and accurate understanding of how engaged their patients are in their care, healthcare organizations must combine several patient metrics and use insights from multiple data sources, both digital, such as patient portals, patient apps, and wearable devices for remote patient monitoring, and traditional, such as patient advisory groups and community ambassador programs. This dual approach ensures no patient segment is left behind due to digital literacy gaps or technological access barriers.
Scales and questionnaires
Researchers have developed a number of patient engagement measures, each offering unique insights. However, no single instrument is mandatory or universally preferred. Healthcare organizations should choose the tools that best align with their specific goals, patient population, and care strategies.
- Patient Activation Measure (PAM) — a questionnaire that assesses a patient's level of activation across four progressive stages: believing the patient's role is important; having the confidence and knowledge necessary to take action; taking action to maintain and improve one’s health; and staying the course even under stress. Originally developed as a 100-item research tool, it has since been abridged for practical use in clinical settings.
- Patient Health Engagement (PHE) scale — evaluates emotional and psychological readiness to engage in care.
- Public and Patient Engagement Evaluation Tool (PPEET) — measures the effectiveness of engagement activities at the organizational level.
- Electronic Patient Engagement Behavior (EPEB) scale — focuses on electronic engagement behaviors across four dimensions: disease information search, doctor–patient communication, social support among patients, and disease self-monitoring through apps and wearables.
Behavioral metrics
In addition to standardized tools, ScienceSoft experts recommend analyzing the following key information flows to gain deeper insights into patient engagement:
- Digital behavior (portals & apps) — to monitor how often and how broadly patients use online tools, such as patient portals or mobile health (mHealth) apps, to access records, message providers, engage with health educational content, or utilize in-app or in-portal tools like a health tracker.
- Appointments and follow-ups — to track the rate of scheduled versus missed or canceled appointments, follow-up attendance, and appointment booking success rates.
- Patient-generated health data (PGHD) — to evaluate the frequency and consistency with which patients share health data (e.g., glucose levels, blood pressure, or physical activity) through connected apps or devices.
- Patient satisfaction surveys — to capture patient perceptions, experiences, and preferences. These can be collected via formal surveys, interviews, online feedback forms, or focus groups to assess emotional and experiential engagement.
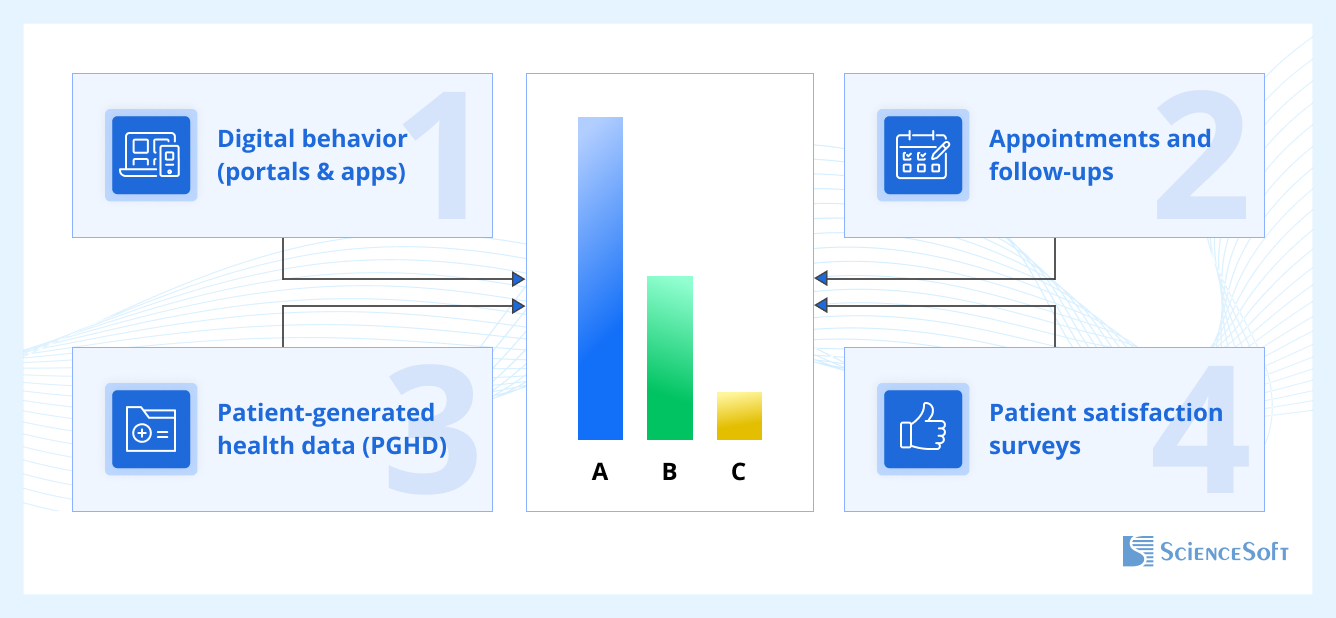
By assessing each stream individually and in combination, healthcare providers can classify patients into engagement levels, for example, using an ABC rating system:
- Group A: Highly engaged (e.g., regular app usage, high appointment adherence, consistent data sharing)
- Group B: Moderately engaged (e.g., occasional digital activity, partial follow-through)
- Group C: Low engagement (e.g., infrequent interaction, missed follow-ups, poor adherence)
Below, we provide an example of how behavior metrics can be used to map out corresponding tiers of patient engagement. The actual target frequency and specific metrics may vary for different providers.
| Patient Engagement Tiers Based on Behavior Metrics | |||
| Metric | High engagement (A) | Medium engagement (B) | Low engagement (C) |
| Portal/app usage frequency | Daily/weekly logins | Monthly use | Rare or none |
| Scope of portal/app features used | Multiple functions (e.g., vitals tracking, messaging, appointments) | Limited feature use | Minimal or none |
| Appointment completion | ≥80% completed | 60–79% | <60% |
| Follow-up attendance | 70–100% completed within 1–2 months | <70% on time | <30% on time |
| PGHD sharing | Regular and consistent | Incomplete or irregular | Rare or missing |
| Medication adherence | ≥80% taken as prescribed | 50–79% | <50% |
| Physical activity (tracked) | 70–100% of the target level | 50–69% | <50% |
| Survey participation | Completes 60–100% | 30–59% | <30% |
Other indicators of patient engagement may include:
- Telehealth usage — frequent participation in virtual consultations suggests digital readiness and proactive engagement.
- Readmission rates — high rates may indicate poor engagement in post-discharge planning and low involvement in post-discharge care.
- Patient retention rate (PRR) — reflects patient loyalty and satisfaction over time.
Patient Segmentation for Effective Engagement Measurement
To identify a correlation between individual health profiles and patient engagement levels, healthcare providers can segment patients based on specific criteria. The segmentation should ideally be powered by healthcare analytics systems.
Here are some key dimensions that healthcare providers can use — individually or in combination — to create insightful patient segments:
1. Facility
Patients may receive care across multiple sites. Segmenting by facility helps identify where engagement is strong or lacking.
Examples:
- Outpatient: Oklahoma City, Stillwater, Edmond
- Inpatient: Boston, Worcester, Springfield
- Mixed Facilities: Louisville, Indianapolis, Fort Wayne
2. Therapeutic Department
Segmenting by department enables insights into engagement trends among patients with specific conditions.
Examples: Cardiology, Pulmonology, Orthopedics, Endocrinology, ENT
3. Disease Status
This dimension can help uncover how the level of engagement correlates with condition types and clinical progress.
- Stage: Acute, Subacute, Chronic
- Comorbidities: Yes / No
- Outcomes: Recovery, Complications
- Disabilities: Yes / No
- Need for Supervision: Yes / No (e.g., follow-ups, home care)
4. Demographics (Age & Gender)
The following age breakdown is based on a combination of Erikson’s stages of human development with Daniel Levinson's and Carl Jung’s theories. Aggregating various classifications helps capture both psychological and physical development within the age segmentation.
Examples:
- Men/Women > 65
- Adults ≤ 65: 18–25, 26–35, 36–50, 51–64
Once patients are segmented, providers can identify engagement patterns across patient engagement platforms (e.g., portal vs. app), demographic groups, locations, or conditions. For instance, comparing patient platform usage across departments can reveal platform preferences by condition.
Moreover, combining engagement data with health outcome measures, such as quality of life or blood pressure control, enables providers to assess the actual impact of engagement on these outcomes. While higher engagement often aligns with better outcomes, unexpected patterns may emerge, offering new opportunities for care improvement and personalization.
Why Measuring Patient Engagement is Key Now
According to 2025 predictions in healthcare, compiled by Managed Care Executives, the patient engagement movement is expected to advance in 2025; however, growing "engagement fatigue" may slow progress. As patients face an overload of digital messages, streamlining and personalizing communication is key. And this can’t be achieved if providers do not have a functioning system for measuring patient engagement in place. With the right patient engagement metrics, patient experience metrics, and patient satisfaction metrics, providers can identify gaps in care and create a more meaningful, personalized care experience for patients.
