Sensor Data Analytics
A Complete Overview
In data analytics since 1989, ScienceSoft helps businesses in 30+ industries implement secure IoT analytics solutions that enable real-time decision-making, automation, and optimization of human, material, and energy resources.

Sensor Data Analytics: The Gist
Sensor data analytics is needed to gather and analyze the data from sensor-equipped devices used in various fields: manufacturing, healthcare, insurance, investment, retail, oil and gas, automotive, energy, transportation, logistics, agriculture, smart cities, and more.
Such solutions enable ad hoc and real-time data analytics to monitor environmental conditions, optimize asset utilization, and enable preventive maintenance. Sensor analytics solutions also leverage AI/ML-powered capabilities to predict critical events, build highly accurate forecasts, mitigate long-term risks, and enable process automation via intelligent commands.
- Implementation costs: $70,000–$500,000, depending on the number of integrated sensors, the diversity of data types, the complexity of analytics processes, and more. Get a custom ballpark estimate for your case with our online cost calculator.
- Implementation results: up to 60% savings in overall business costs.
Sensor Data Analytics: Key Features
At ScienceSoft, we develop sensor data analytics solutions tailored to our clients’ unique needs. Below, our consultants outline the major sensor analytics features that are universal across all industry applications.
![]()
Sensor data processing and storage
- Collecting and filtering raw sensor data and ingesting it into a data lake.
- Automated cleansing and unification of sensor data.
- Centralized storage of highly structured sensor data and metadata that enables fully contextualized analysis of historical data via user queries.
![]()
Sensor data analysis and reporting
- Monitoring sensor-equipped objects.
- Detecting critical events based on pre-set fault-determining parameters (e.g., excessive humidity or vibration level) and sending real-time alerts or commands.
- Diagnostic analytics to identify root causes behind various outcomes.
- Predictive analytics for accurate forecasting and predictive maintenance.
- Prescriptive analytics to provide optimization recommendations, e.g., in production processes, patients’ treatment, resources utilization, and more.
- Interactive dashboards for visual data representation with drag-and-drop functionality, slicers, and filters.
- Scheduled and ad hoc reporting.
Industry-Specific Uses of Sensor Data Analytics
![]()
- Remote patient monitoring and IoT for medical devices.
- Identifying trends in patient symptoms to determine the factors influencing patient health and help improve care outcomes.
- Tracking hospital assets and resource consumption and optimizing their use.
![]()
- Monitoring vehicle production process to optimize it and reduce losses.
- Monitoring vehicle state and performance (e.g., speed, fuel consumption, engine temperature).
- Detecting unsafe driving and alerting the driver (e.g., in case of drowsy driving).
- Analyzing road conditions (e.g., speed limits, accidents, construction works) and sending alerts.
- Predictive maintenance for manufacturing equipment or vehicles (e.g., forecasting the need for parts to be serviced or replaced).
![]()
Agriculture
- Monitoring weather conditions, crop growth and health.
- Monitoring the chemical composition (acidity, moisture, nutrient levels) of soil and agricultural waste.
- Real-time livestock monitoring (e.g., location, body temperature).
- Monitoring and automatically adjusting greenhouse conditions based on pre-set parameters and real-time sensor data.
![]()
- Equipment monitoring and performance optimization.
- Fleet management (e.g., real-time tanker monitoring).
- Power grid monitoring and energy distribution optimization.
- Predictive maintenance, including for remote & offshore facilities.
- Hazard management & prevention (e.g., leakage detection and alerts).
- Optimizing the use of physical and human resources to reduce environmental impact and improve the bottom line.
![]()
- Optimizing inventory management based on sensor data from smart shelves and fridges.
- Improving the merchandising strategies based on the analysis of customer traffic patterns and behavior.
- Tracking staff movement and interactions with customers.
- Supply chain monitoring and optimization.
- Detecting fraud and theft attempts.
![]()
- Monitoring vehicle performance and driver behavior (e.g., driving speed, unnecessary stops, fuel consumption).
- Monitoring cargo conditions and adherence to storage specifications.
- Optimizing logistics routes and delivery times based on road condition analysis, e.g., traffic jams, tollbooth queues, construction works.
- Public transportation monitoring & analytics: intelligent routing and dispatch, vehicle condition monitoring, ticketing and real-time information systems for passengers.
![]()
- Monitoring air quality, energy consumption, driving patterns, vehicle and foot traffic flow, etc.
- Enabling predictive city infrastructure maintenance.
- Forecasting energy and water consumption.
- Root cause analysis and intelligent suggestions to improve traffic management, resource consumption, waste management, and public health.
![]()
- Assets monitoring (e.g., office buildings, ATMs, CIT vehicles).
- Monitoring and analyzing facilities’ environment and foot traffic to optimize HVAC and lightning resources consumption.
- Monitoring goods movement for trade finance companies to increase their visibility and security.
![]()
- Continuous monitoring of the insured objects.
- Sending alerts in case of malicious activity, asset failure, high damage probability, etc.
- Predicting the probability and severity of loss events and pricing insurance services accordingly.
- Tracking and analyzing the behavior and health state of the insured persons via medical devices and smart wearables and providing recommendations on the proper actions to minimize life and health risks (for pay-as-you-live insurance).
High-Level Architecture of Sensor Data Analytics Software
Below, we describe a sample architecture of an advanced sensor data analytics solution with real-time analytics and ML functionality.
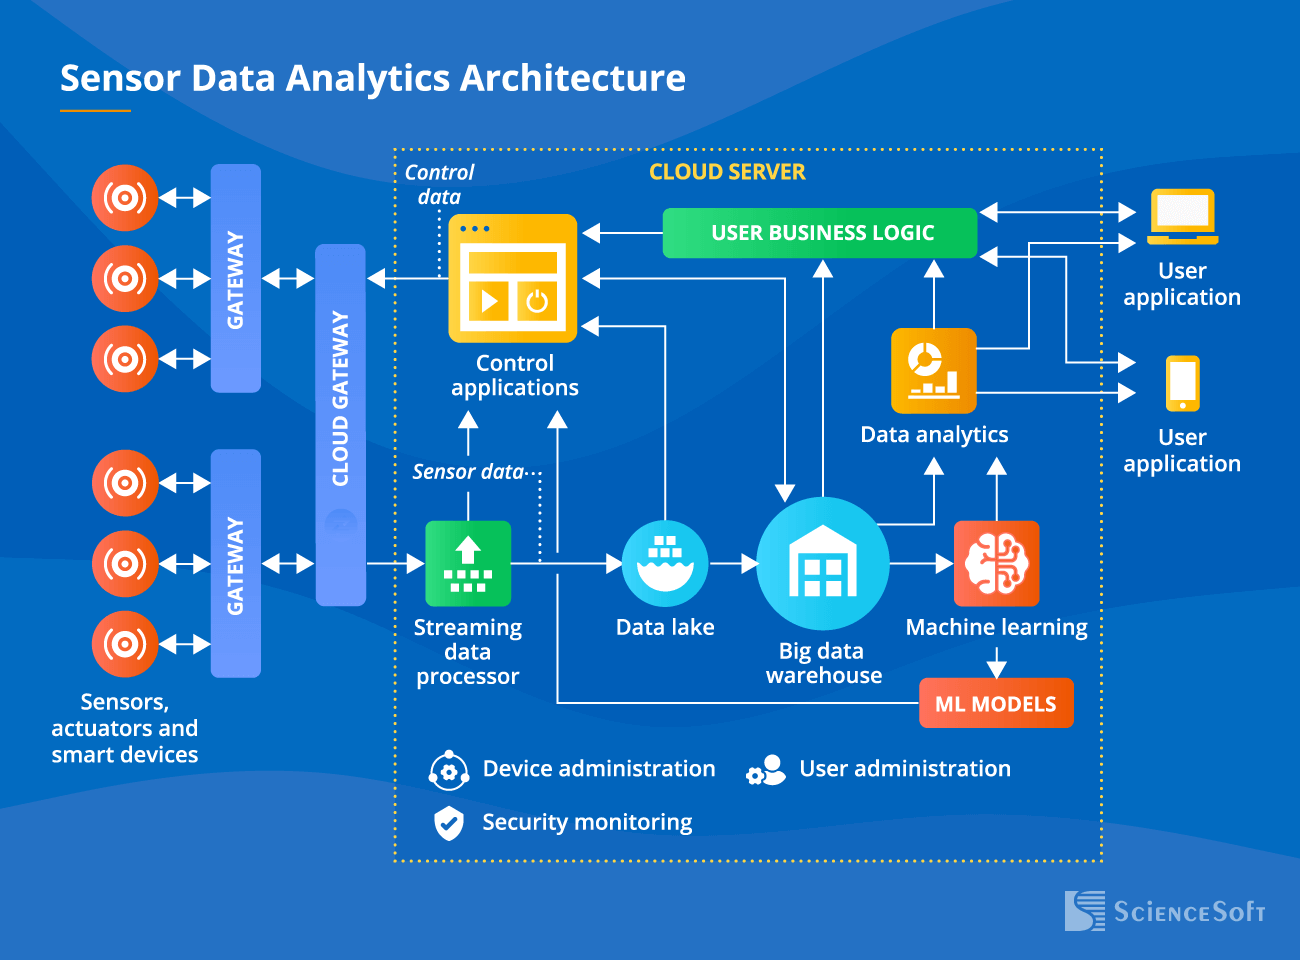
Sensors and smart devices gather data and transmit it via field and cloud gateways to the streaming data processor. It performs the initial processing of the data and pushes it in two directions:
- To control applications that send commands to actuators if a pre-set event or an anomaly is detected (e.g., adjusting room temperature in case the pre-set limit is crossed).
- To a data lake where structured (e.g., temperature readings) and unstructured (e.g., raw video) data is stored until it needs to be analyzed.
After being transformed, cleaned, unified, and otherwise prepared for analytics, sensor data lands in a big data warehouse. A big DWH also stores sensor metadata (machine configurations, sensor deployment location, etc.) and data from control applications, which enables fully contextualized analysis.
A big data warehouse is a source of high-quality data for:
- The analytics module that identifies trends and dependencies in the data, generates scheduled and ad hoc reports, builds forecasts, and offers recommendations.
- The ML module (optional). The module enables control applications to trigger actions. These models are continuously updated to remain precise and efficient.
The users access the system via user applications that allow them to monitor the sensor-equipped assets and their performance, send manual commands to control applications, fine-tune the ML models, and create custom reports.
Costs and Benefits of Sensor Data Analytics Solution Implementation
Depending on the software complexity, the cost of implementing sensor data analytics may vary from $70,000 to $500,000*.
![]()
$70,000–$150,000
For a sensor data analytics solution that:
- Enables batch data processing.
- Provides rule-based analytics.
- Integrates with a limited number of sensor data sources and device types.
![]()
$150,000–$300,000
For a solution of medium complexity that:
- Enables batch and real-time data processing.
- Provides rule-based and basic ML-powered analytics.
- Integrates with multiple sensor data sources and device types.
- Enables users to send manual commands to actuators.
![]()
$300,000–$500,000
For an advanced solution that:
- Enables batch and real-time data processing.
- Enables stream analytics and sending automatic commands to actuators in case of abnormal readings.
- Provides rule-based and advanced ML-powered analytics.
- Integrates with any required number of sensor data sources and device types.
Want a more precise figure?
ScienceSoft’s consultants are ready to estimate the cost of your sensor data analytics solution.
Implementation of sensor data analytics brings:
Popular IoT Platforms to Build Sensor Analytics Solutions
Below, ScienceSoft’s consultants describe the pros and cons of the market-leading platforms suited for building advanced sensor analytics solutions.

AWS IoT
Best for: smart cities, connected homes, agriculture and healthcare solutions
Features
- AWS offers 4 different sensor analytics services for solutions of different complexity: e.g., event-based responses with AWS IoT Events and comprehensive analytics with AWS IoT Analytics.
- 7 specialized products and services for sensor device management and connectivity.
- Industry-specific services: AWS IoT FleetWise for fleet data management and AWS IoT SiteWise for industrial data analytics.
- Easy integration with other AWS tools and services: e.g., Amazon QuickSite for visualization, SageMaker for ML, Amazon Kinesis for stream processing.
- A wide variety of SDKs that facilitate the development of mobile and server-side IoT solutions.
- Broad hardware compatibility thanks to Amazon’s multiple partnerships with device manufacturers.
Caution
Some of the services are limited or unavailable for on-premises and edge deployment. The integration, development, and support of AWS-based sensor analytics solutions require advanced technical skills.
Pricing
-
Free tier: includes up to 2.25M connection minutes, 500K messages, 225K registry/shadow operations, and 250K rules/actions during the first 12 months.
-
Connectivity: charged per million connection minutes, rates vary slightly by region.
-
Messaging: charged per million messages, with price depending on size and delivery type.
-
Other services (e.g., registry/shadow operations, rules engine, fleet management) are billed separately.

Microsoft Azure IoT
Best for: healthcare, retail, manufacturing, logistics, and transportation
Features
- Microsoft offers 8 different services and products for building sensor analytics solutions of different complexity: e.g., Azure IoT Hub for device management and Azure IoT Central for analytics functionality.
- Smooth integration with Microsoft’s analytics services, including Azure Machine Learning and Azure Databricks.
- Robust security services (e.g., Azure RTOS, Azure Sphere).
- Efficient tools and services for edge deployment.
- A good choice of integrators and technology partners thanks to Microsoft’s extended partnership ecosystem.
Caution
The diversity and complexity of the platform’s services and pricing makes it effort- and time-consuming to choose the relevant case-specific components and optimize the costs.
Pricing
-
Free tier: IoT Hub offers a free edition with ~8,000 messages/day (0.5 KB message size) for testing.
-
Paid tiers: Basic and Standard tiers charge by the number of units you provision and the daily message allocation. Messages are billed in 4 KB blocks.
-
IoT Central: pricing is device-based and message-based, with monthly allocations per device and overage rates for extra messages.
Consider ScienceSoft to Implement Your Sensor Data Analytics
With an in-house PMO and mature project management practices, we successfully handle initiatives of any complexity and drive projects to their goals regardless of time and budget constraints.

Consulting on sensor data analytics
Implementing sensor analytics is a big move, and ScienceSoft’s experts are ready to help you avoid unnecessary risks and gain confidence in your initiative. Our team will build a detailed business case, estimate the project costs & ROI, design a robust architecture, and suggest the right tool stack.

Implementation of sensor data analytics
We know how important it is to do the job right on the first try when it comes to large IT initiatives. That is why ScienceSoft’s priority is to build a secure, scalable, and highly efficient data analytics solution that your organization will rely on for decades to come.
About ScienceSoft
ScienceSoft is an AI transformation and software development company headquartered in McKinney, Texas. Since 1989, we help companies across 30+ industries leverage advanced data analytics to drive their business growth. We have developed mature quality and security management systems supported by ISO 9001 and ISO 27001 certifications to provide our clients with world-class software and guarantee complete data protection.
