Retail Business Intelligence
Key functionality, integrations, costs, benefits, and more
ScienceSoft presents an overview of features, integrations, success factors, cost components, and benefits of retail business intelligence solutions.

Retail Business Intelligence: Definition and Benefits
Retail business intelligence is needed to collect, process, and analyze retail-specific data and present analysis results in the form of easy-to-read reports and dashboards. Retail BI solutions help businesses increase customer satisfaction and improve customer retention, optimize assortment, plan marketing campaigns, identify new sales opportunities, and more.
- Implementation time: 2–6 months for an MVP.
- Implementation costs: $80,000–$1,000,000, depending on solution’s scope. Use our online calculator to get a tailored cost estimate.
- Essential integrations: CRM, an ecommerce platform, a point of sale system, customer service software, marketing campaign management software, inventory management software, supplier management software.
Retail BI Solution: Core Functionality
At ScienceSoft, we tailor retail BI solutions to the specific business processes of our clients. Here, we’ve compiled a set of solution features commonly requested by the retail organizations we work with.
![]()
Retail data consolidation, processing and storage
- Automated ingestion of retail data (product data, customer data, transactional data, etc.) from heterogeneous internal and external data source systems (CRM, ERP, POS systems, supply chain management systems, customer data platform, social media, etc.).
- Support for batch and real-time data ingestion (sensor data from brick-and-mortar stores, financial transactions data, etc.).
- Automated retail data cleansing and transformation capabilities (data deduplication, standardization, conversion, etc.).
- Storing structured, semi-structured, unstructured retail data of any size in the data lake for achieving and further processing.
- Consolidation of highly structured retail data into the data warehouse in the relational, columnar and multidimensional formats optimized for analytical querying.
- Consolidation of transactional and sensor data in the operational data store for operational reporting.
![]()
Retail data analysis and reporting
- Online analytical processing (OLAP) to enable multidimensional retail data analysis (e.g., sales by channel, region, store, brand, product category).
- Retail data mining capabilities to apply classification, time-series analysis, clustering, etc., and identify unusual patterns and trends within huge data sets (e.g., customer behavior data mining for identifying sales drivers, churn drivers).
- Machine learning capabilities to enable forecasting (sales forecasting, demand forecasting, etc.), what-if scenarios modeling (e.g., for inventory planning), ML recommendations (tips on inventory replenishment, product placements, etc.), and more.
- Support for (near) real-time retail data analytics.
- Scheduled and ad hoc reporting capabilities.
- Self-service analytics and reporting capabilities.
- Mobile reporting capabilities.
![]()
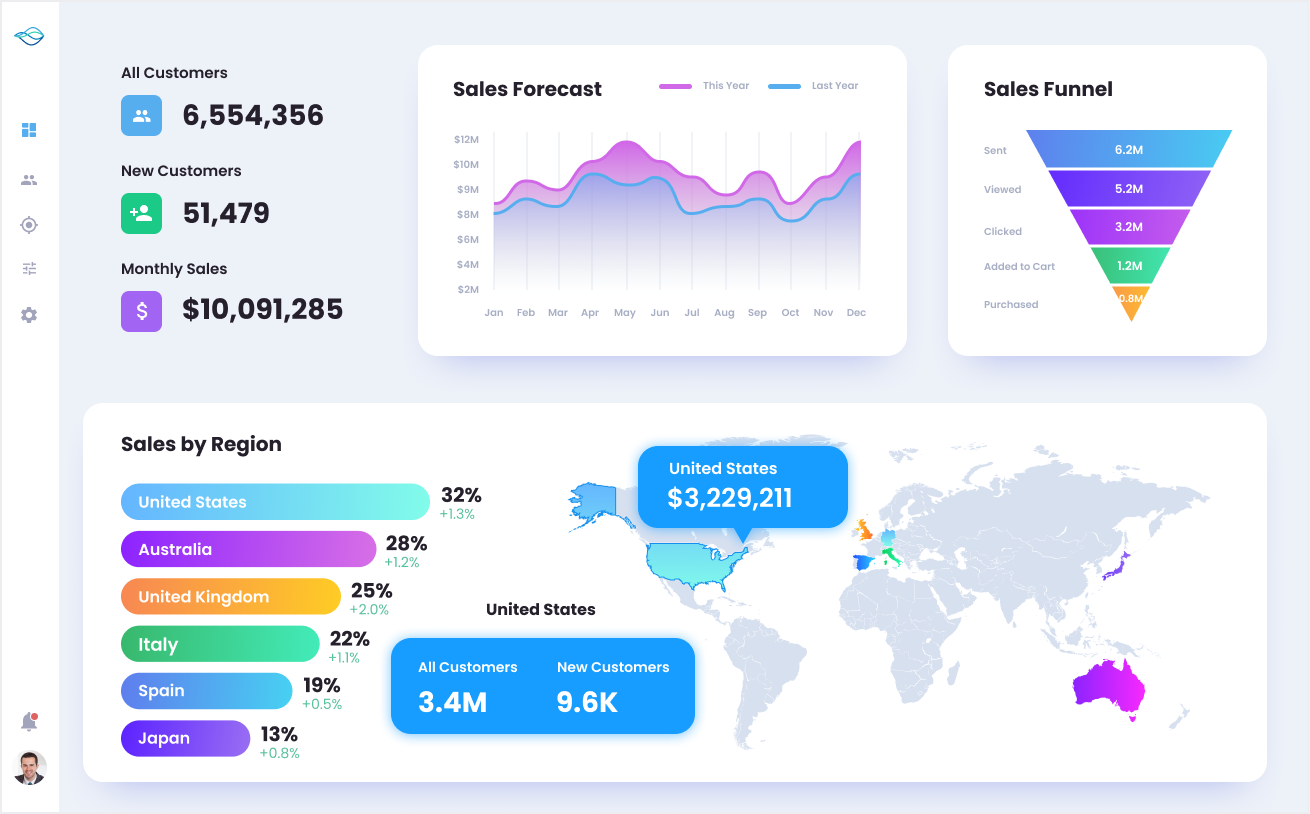
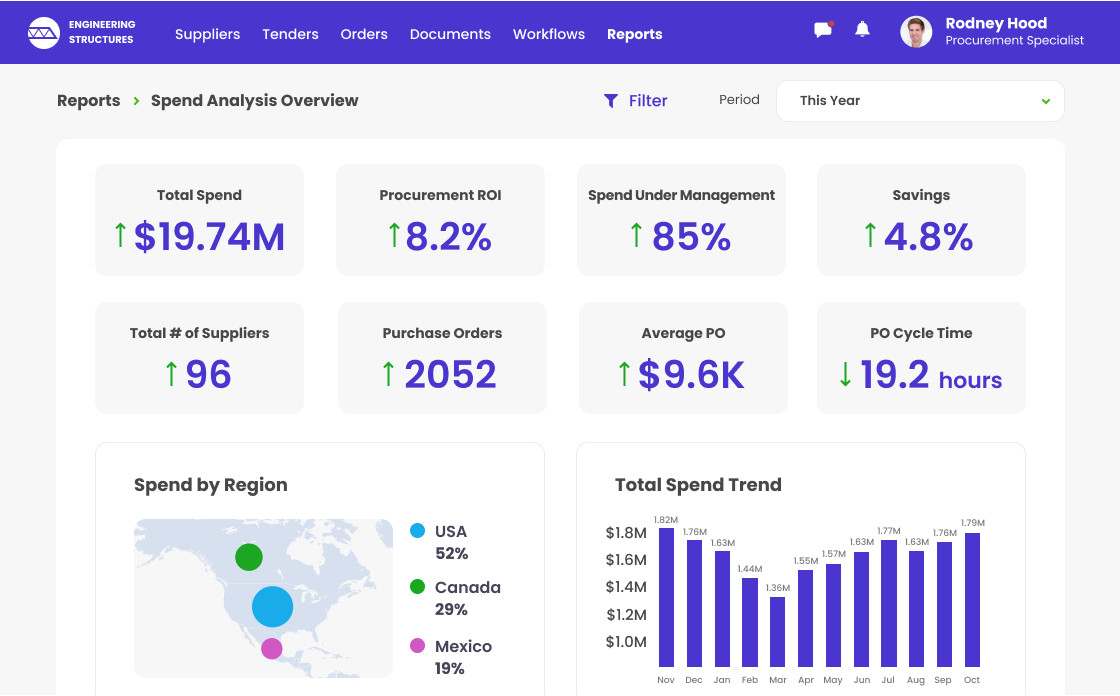
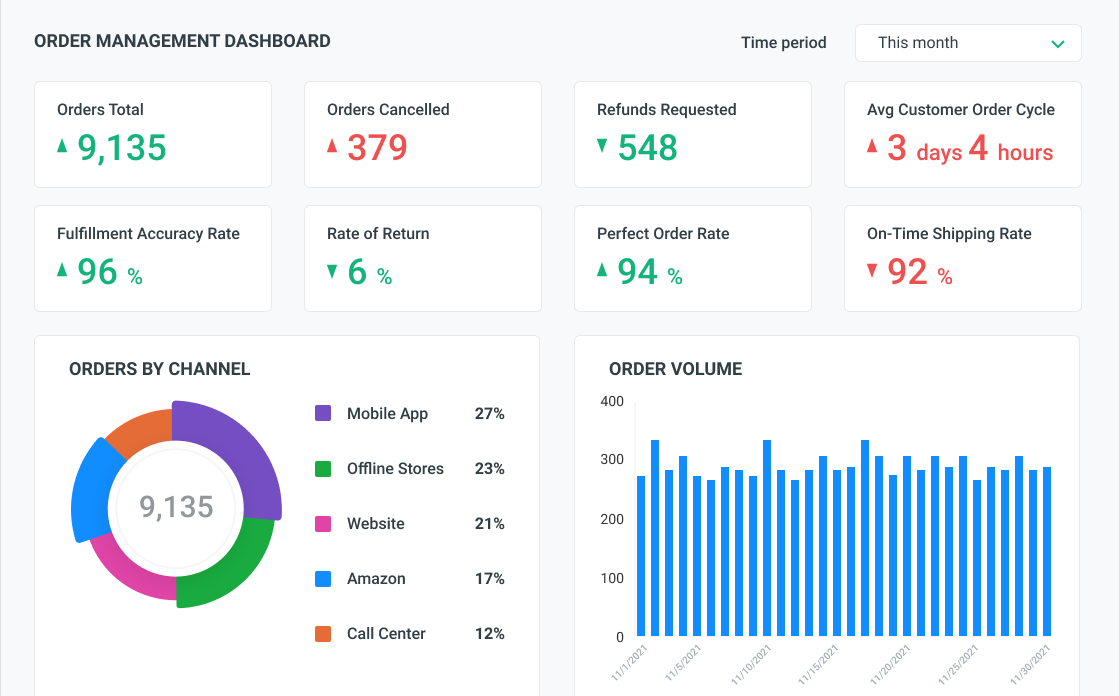
Retail data representation
- Templates of reports on diverse sets of KPIs (website traffic/foot traffic, average transaction size, total volume of sales, sell-through rate, customer retention, total orders, monthly revenue per employee, etc.).
- Pre-built retail reports and dashboards for all types of business users (C-suite, retail department managers, retail operations managers, sales reps, business analysts, etc.).
- Interactive retail dashboards with dynamic filters, drag-and-drop capability and NLP interface for agile data presentation (e.g., the possibility to drill down overall sales volumes to sales volumes of a particular brand, product category, SKU).
- Analytics content embedded directly into business applications for prompt usage.
- Mobile and paginated retail reports.
![]()
Retail data security
- Automated discovery and labeling of sensitive retail data.
- Securing sensitive retail data with data encryption at rest and in transit and dynamic data masking.
- Role-based and attribute-based access control.
- Configurable retail data security levels (row, column, table, workspace, report, etc.).
- Support of different user identification methods (password-based, multi-factor, token-based, etc.).
![]()
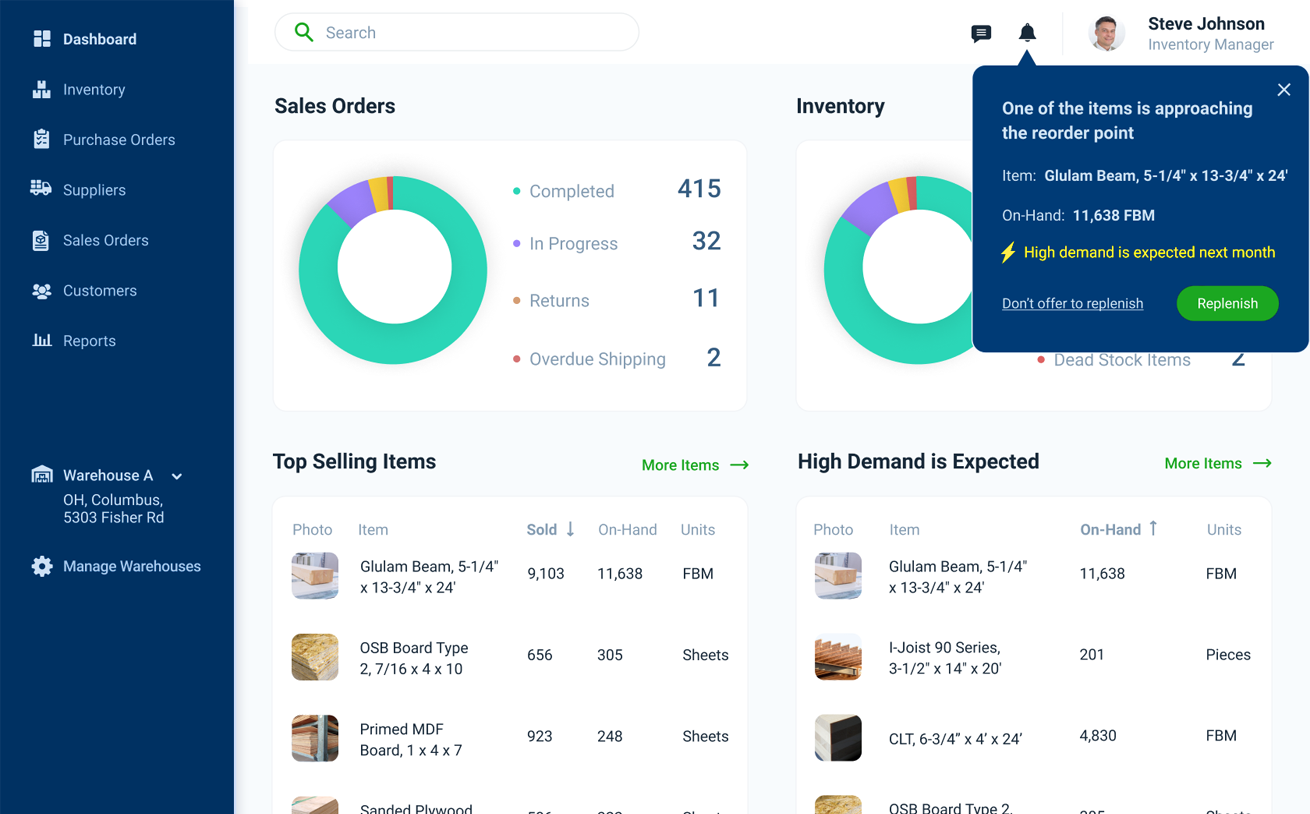
- Multi-channel and multi-store inventory monitoring (inventory on hand, low-stock inventory, inventory location, days sales of inventory, inventory discrepancy, aged inventory, etc.) with drill-drown capabilities.
- Inventory analytics based on historical sales data, forecasted demand, average lead time, weather conditions, and more (e.g., to define optimal inventory stock levels, SKU-level minimum and maximum quantity thresholds for each product category, plan inventory purchasing or replenishment).
- Inventory investment analytics (calculating average inventory turnover ratio for each brand, category, SKU, gross/net inventory profitability analysis, etc.).
- Inventory demand forecasting (for brand/product/SKU, across sales channels and store locations) based on the identified demand patterns for each store or customer segment, promotional uplift, price elasticity, seasonality, product cannibalization, competitors’ activity, etc.
- What-if inventory scenarios to outline various inventory purchasing, replenishment, allocation and transfer plans in case of supply disruptions, rush orders, inventory out-of-stock/overstock, etc.
![]()
Assortment optimization
- Product assortment assessment with the possibility to drill-down to the SKU level based on such KPIs as space productivity, margin per unit, product sales per week, per store, or per basket, product out-of-stock ratio, etc.
- Automatic calculation of the penetration rate of each brand/product category/SKU across pre-defined customer segments, sales channels, particular store locations, etc.
- Identifying brands/product categories/SKUs that show max/min potential in terms of their ability to attract traffic.
- Identifying SKUs/product categories/brands with minimal penetration levels for discontinuation.
- Transferable demand calculation based on such factors as loyalty towards an item, an item’s uniqueness, substitutability, overall value.
- Automated optimal assortment planning at any level of granularity (organization, store cluster, individual store level).
![]()
- Perceived value analysis to identify the price customers are willing to pay for a product.
- Price elasticity analysis to define and adjust prices for specific customer segments, markets, etc.
- Monitoring and analyzing market price benchmarks and pricing strategies of competitors.
- Price gap analysis.
- Dynamic price optimization modeling to tailor the initial pricing, promotional pricing, markdown pricing strategies for products and product categories across customer segments.
![]()
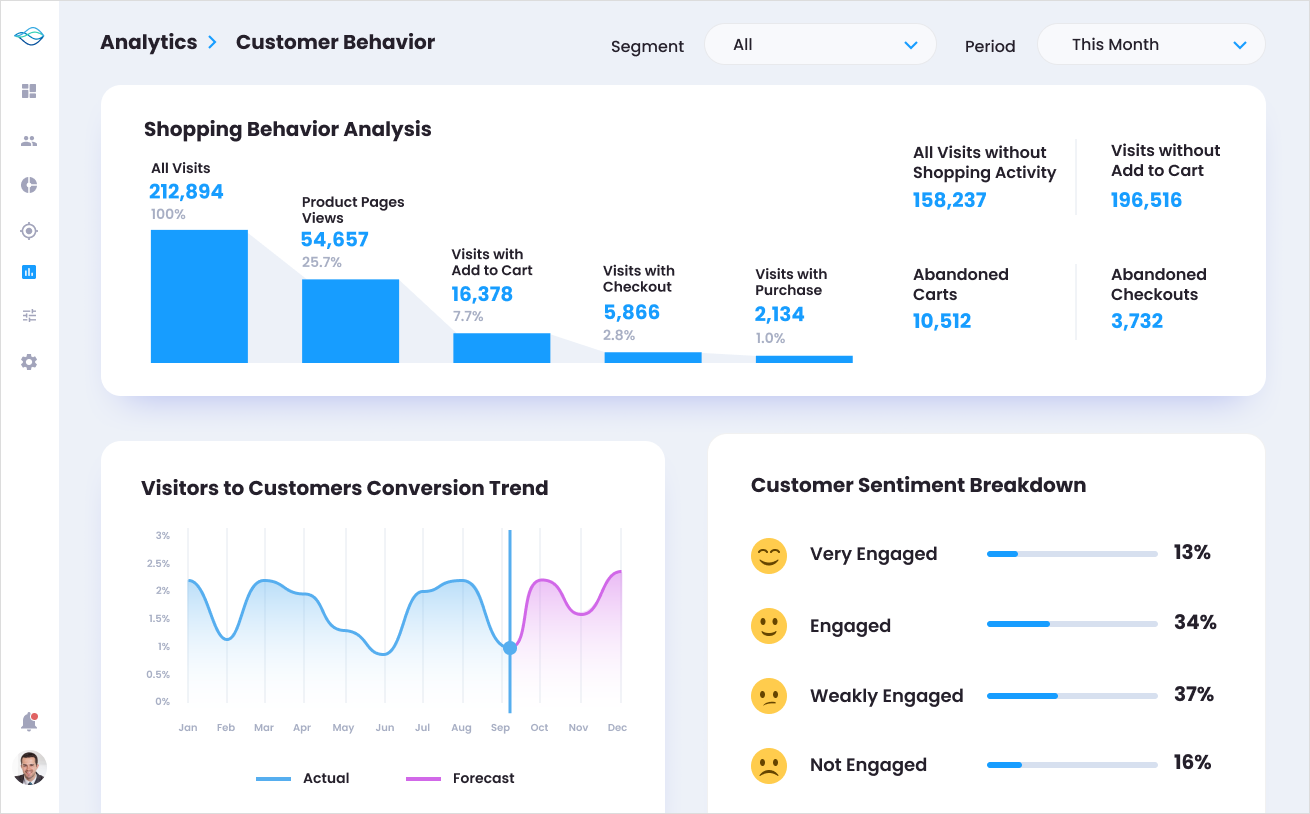
- Analysis of customer buying frequency and customer engagement.
- Customer satisfaction and loyalty analysis across offline and online sales channels.
- Customer segmentation analytics (analysis of the existing customer segments and their share in the chain/store, analysis of the average basket composition of customer segments, transitions between customer segments based on changes in behavior patterns, etc.).
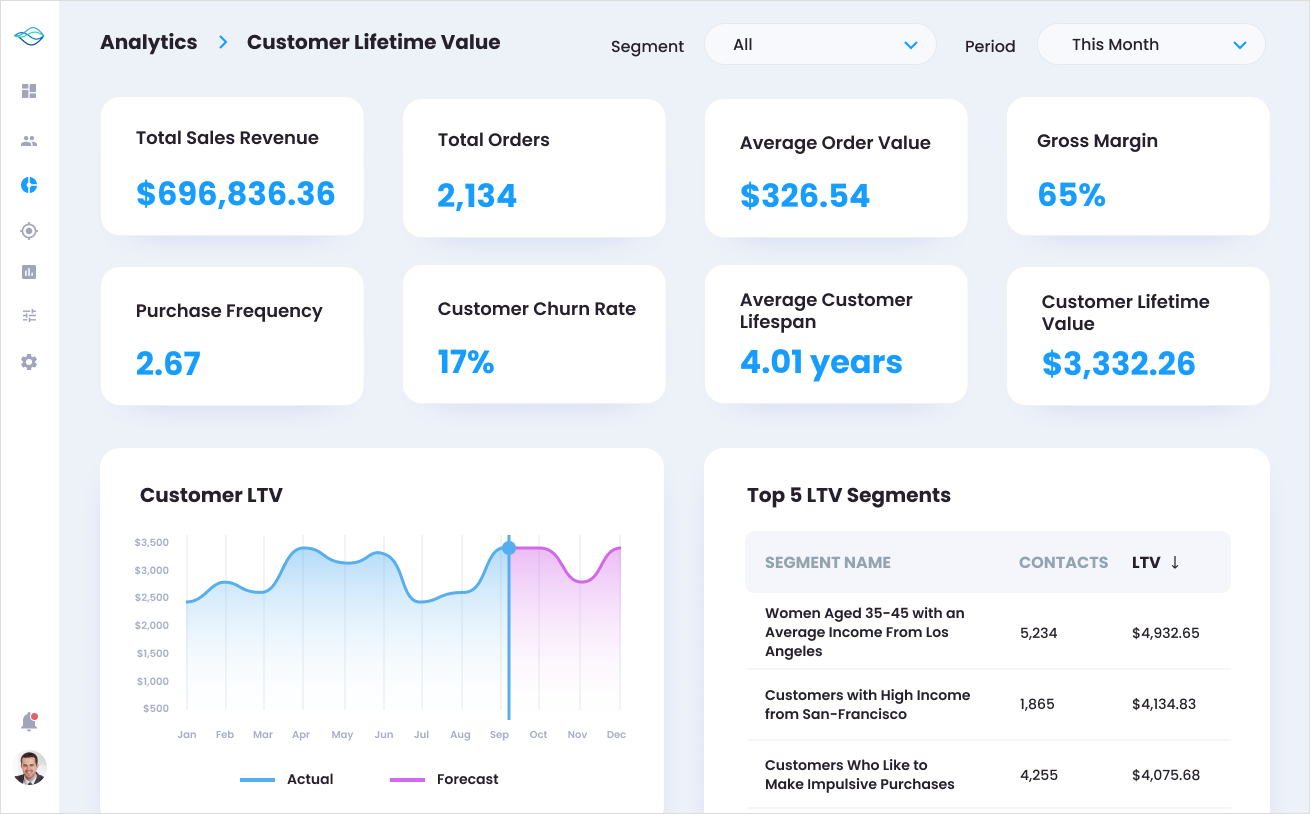
- Customer profitability analysis across segments, including customer acquisition analysis (cost per acquisition, cost per lead, return on ad spend, return on new customers, etc.).
- Calculating customer lifetime value.
- Customer attrition analysis to identify patterns leading to churn.
- Customer retention analysis (customer renewal rate analysis, retention costs analysis, etc.).
- Customer behavior modeling (converting, churning, spending more/less, etc.).
![]()
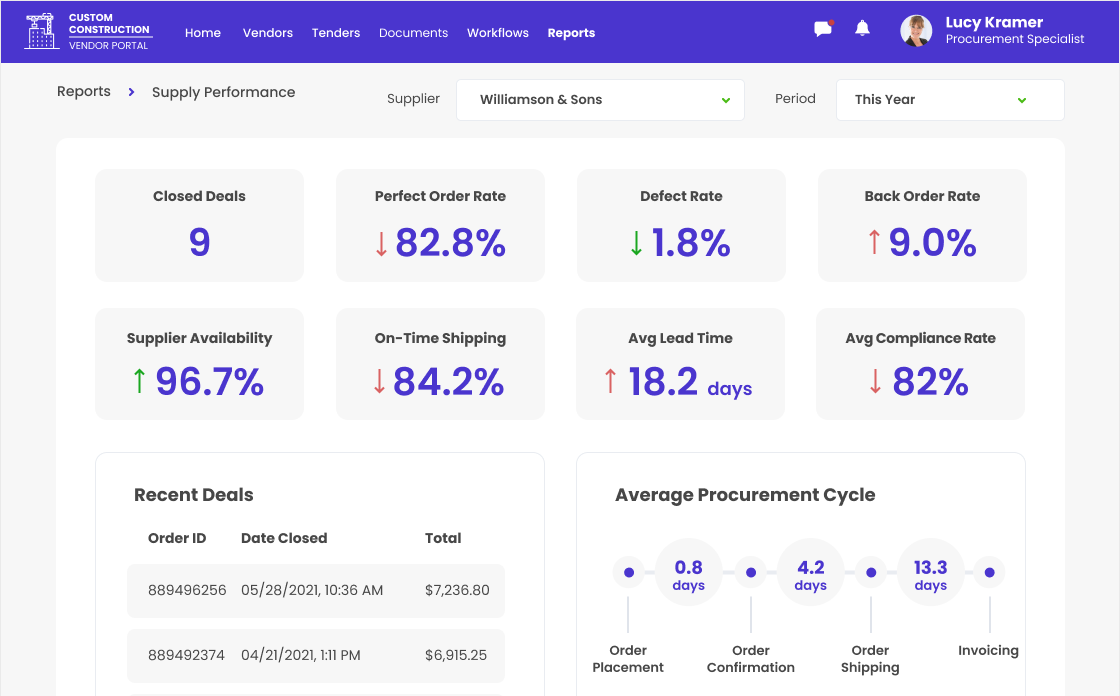
Supplier analytics
- Supplier performance analysis and scoring based on on-time fulfillment rate, the ability to cater to demand fluctuations, shipment accuracy, etc.
- Supplier risk forecasting based on past supplier performance.
- Supplier benchmarking and evaluation:
- Assortment and price comparison.
- Supplier terms and conditions comparison.
- Gross profit comparison (per each supplier).
- Supplier share in a product category.
- Identification of suppliers with maximum potential.
- What-if scenario modeling to identify the impact on product cost/profitability due to a supplier change.
![]()
Merchandising and marketing optimization
- Product affinity modeling based on product category and attributes, products’ potential to mutually cannibalize each other, etc. to identify suitable product bundles for different stores/groups of stores during different seasons or time of day.
- Product placement layout efficiency analysis to optimize merchandize, upselling and cross-selling.
- Optimal product placement modeling.
- Promotion analytics (evaluating the effect of promotional sales across sales channels/customer segments, comparing basket size and cost with and without promotional products, comparing promotional product turnover ratio while / before a promotion, identifying the optimal promotional products for each customer segment, etc.).
- Promotional effectiveness analysis.
- Markdown optimization and planning for each brand/product category/SKU.
- Marketing campaign effectiveness assessment (repeat customer traction, campaign sales, website traffic, etc.).
- Marketing channel performance assessment and marketing channel prioritization.
- Loyalty programs analysis and optimization.
![]()
- Tracking sales KPIs (sales growth, sales targets, sales per rep, sales per square foot, sales by region, sell-through region, sales per products, average purchase value, etc.).
- Sales performance analytics (sales by channel, region, store, brand, product category, purchase frequency per product category/brand, etc.) and benchmarking (salespeople, products, sales channels, etc.).
- Forecasting sales potential for each product category/SKU based on sales history data mining.
- Shopping cart analysis (tracking dependencies in consumption, identifying low-margin SKUs, etc.) and segmenting carts by their size and type (for seniors, for singles, for the family, etc.).
- New stores performance analytics (monitoring store activities, comparing new stores to those already functioning, identifying hidden sales opportunities, etc.).
- Predicting sales for each brand/product category/SKU based on historical sales data analysis and identification of seasonal variations, sales outcomes modelling.
- Sales planning with the possibility to drill down to a particular store/brand/product category/SKU.
Check the Insights You Can Get with Retail BI
Essential Integrations for Retail Business Intelligence Solutions
To understand how customers behave, how various sales channels perform and whether marketing campaigns are effective, ScienceSoft recommends taking care of essential integrations:
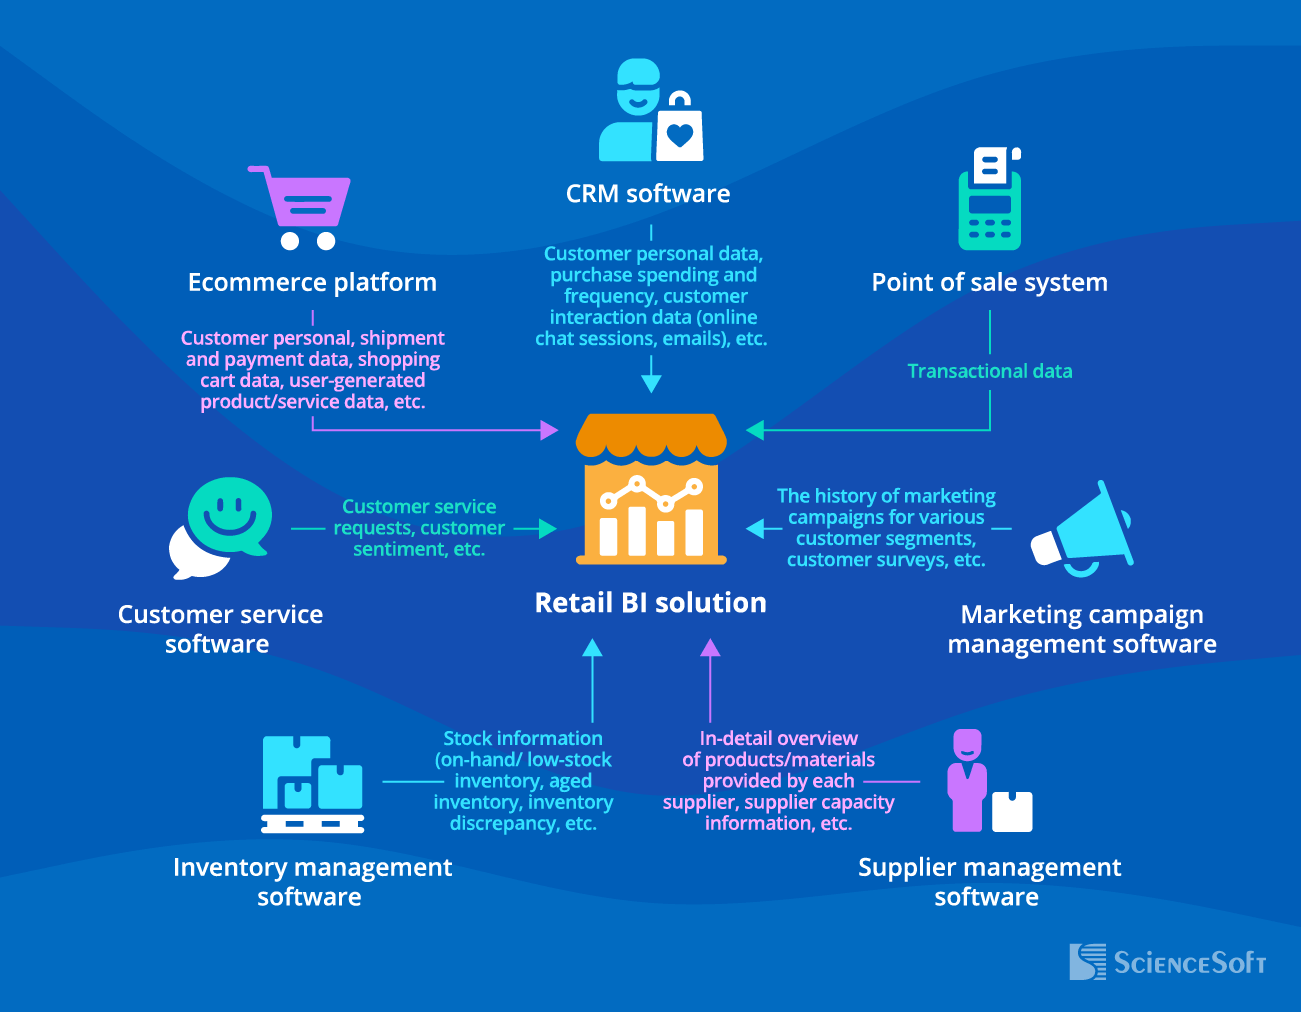
Customer relationship management (CRM) software
- To identify most valuable customers and customer segments and concentrate marketing and sales efforts accordingly.
- To analyze customer engagement, customer satisfaction, profitability, attrition, etc. across customer segments.
Ecommerce platform
Tracking metrics like the conversion rate by devices (PC/tablet/mobile), average order value, revenue and product/service preferences by customer segment, advertising channel performance, return on ad spend, etc. to:
- Analyze sales performance.
- Gain an insight into customer behavior.
- Measure the effectiveness of marketing campaigns, etc.
Point of sale system
- To track customers’ spending habits (preferred payment methods, purchase time, etc.).
- To identify popular product/service bundles.
- To measure promotion effectiveness.
- To assess store performance.
Customer service software
- To determine gaps in customer service, product assortment, etc.
- To create and optimize customer retention strategies for particular customer segments based on the analysis of customer service requests together with customer behavior.
- To analyze customer sentiment for optimized customer service, store product assortment, etc.
Marketing campaign management software
- To create marketing campaigns and optimize marketing activities (upselling and cross-selling, markdown strategies, etc.).
- To measure the success of marketing efforts.
Inventory management software
- To analyze inventory performance and maintain the optimal inventory stock levels.
- To prevent lost sales and decrease operational costs by optimizing store transfer, replenishment and inventory allocation activities.
Supplier management software
- To analyze supplier performance and conduct supplier benchmarking.
- To analyze supplier product performance (top and bottom performing products by supplier).
- To establish the cause-effect relationship between supplier performance and product cost/profitability/sales, etc.
Factors Defining Retail Intelligence Success
Leveraging 36 years of experience in data analytics and 22 years in retail, ScienceSoft defined key factors that influence the success of retail intelligence solutions.
![]()
Self-service analytics and reporting capabilities
Business users with different levels of tech expertise can rely on drag-and-drop functionality, natural language querying support, and highly customizable dashboards to access data independently and support their decision-making.
![]()
A set of data source connectors and easy-to-use APIs
To allow for seamless integration with the existing IT infrastructure and reduced development costs in case of the addition of new data sources.
![]()
Automated data management processes
To improve decision-making by reducing the time consumed for retail data ingestion, aggregation, and analysis and eliminating error-prone manual data management activities.
![]()
To secure highly sensitive customer and financial data, meet regulatory compliance requirements (e.g., GDPR) and enable secure data access and sharing across different employee levels with fine-grained access control, multifactor authentication, dynamic data masking and anonymization, end-to-end data encryption, etc.
Costs and Benefits of Retail Business Intelligence Implementation
The cost of retail business intelligence implementation can vary from $80,000 to $1,000,000+. The major cost factors include the number of integrations and their complexity, the type of data, the need for ML/AI-powered capabilities, reporting and visualization complexity.
![]()
$80,000–$200,000
A basic solution that:
- Integrates with 1 or 2 data sources, e.g., an ecommerce platform, CRM.
- Supports structured data (e.g., sales, customer demographics) and batch data processing.
- Enables rule-based analytics (e.g., providing personalized recommendations based on historical data for the same customer segment).
- Enables scheduled and ad hoc reporting.
- Features basic visualization capabilities (e.g., line, bar, and pie charts).
![]()
$200,000–$400,000
A solution of medium complexity that:
- Integrates with up to 7 data sources, e.g., inventory management and SCM software.
- Supports batch and real-time processing of all data types, including unstructured data like inventory counting images.
- Enables rule-based and ML/AI-powered analytics (e.g., providing personalized recommendations based on customer-specific behavior and preferences).
- Enables scheduled and ad hoc reporting.
- Ensures advanced visualization capabilities (e.g., heat maps to visualize sales performance from a geographical perspective, scatter plots to identify correlations between pricing and sales data).
![]()
$400,000–$1,000,000
An advanced solution that:
- Integrates with multiple data sources and supports analytics across several divisions of a geographically distributed business.
- Enables analytics powered by big data and ML/AI techs, e.g., insights into customer sentiment based on NLP-driven analysis of communication logs; demand forecasts based on data on historical sales, real-time competitor activity, seasonal trends.
- Enables scheduled and ad hoc reporting.
- Features advanced visualization capabilities.
Use our free calculator to get a ballpark cost estimate tailored to your case
Answer a few simple questions about your business needs, and our specialists will get back to you with a custom quote.
The implementation of retail business intelligence enables:
ScienceSoft’s Choice: Tools to Build a Retail Business Intelligence Solution
Below, we share the tools that we frequently use in our retail intelligence projects.

Microsoft Power BI
Best for
Retail data visualization and reporting.
Description
- 120 + native data source connectors including connectors for Azure services (Azure Synapse Analytics, Azure Cosmos DB, Azure Data Lake Storage, etc.) and third-party solutions (Google Analytics, Salesforce Reports, etc.).
- Self-service data preparation and analytics capabilities for non-tech users to run data analysis, create reports and dashboards.
- Scheduled and ad hoc reporting capabilities.
- Interactive reporting and dashboarding capabilities to drill down, drill through and filter retail data.
- Creating dashboards with out-of-the-box visuals (charts, cards, maps, matrix, etc.) and custom visuals created with the Power BI open-source visuals framework.
- Robust data security (data sensitivity labeling, end-to-end data encryption, real-time access monitoring, etc.).
- Cloud and on-premises deployment.
Pricing
- Power BI Desktop – free.
- Power BI Pro – $9.99/user/month.
- Power BI Premium –$4,995/dedicated cloud storage and compute resources/month with annual subscription.
Azure Synapse Analytics
Best for
Enterprise-scale retail data warehousing.
Description
- 90+ pre-built data sources connectors for ingesting structured, semi-structured, unstructured retail data from SQL and NoSQL databases, data lakes, operational data stores, third-party applications backed up with Azure Data factory.
- Native integration with the Azure ecosystem (Azure Data Lake Storage for data lake setup, Azure Data Factory for ETL, Azure Stream Analytics for streaming analytics, Power BI for BI and data visualization, Azure Machine Learning, Azure Cognitive Services for artificial intelligence and ML management, etc.).
- Reporting on all management levels, from the C-suite to department heads, managers and supervisors, is protected with a fine-grained data access control (granular permissions on schemas, tables, views, individual columns, procedures, other objects).
Pricing
- On-demand pricing: $1.20/hour (DW100c) - $360/hour (DW30000c).
- Reserved instance pricing can save up to 65% over the on-demand option (in a 3-year term).
- Data storage: $122.88/TB/month.
Amazon Redshift
Best for
Data warehousing for omnichannel retail analytics.
Description
- Native integration with a data lake (Amazon S3) to enable querying exabytes of structured, semi-structured, and unstructured data for analysis without loading and transformation.
- Native integration with the AWS analytics services (AWS Glue for ETL, Amazon Kinesis Data Firehose for streaming analytics, Amazon EMR for big data processing, Amazon QuickSight for BI and data visualization, Amazon SageMaker for ML management, etc.)
- Manually enabled end-to-end data encryption, granular row-level and column-level security controls.
Pricing
- On-demand pricing: $0.25 - $13.04/hour.
- Reserved instance pricing offers saving up to 75% over the on-demand option (a 3-year term).
- Data storage (RA3 node type): $0.024/GB/month.
Note: No charge for the amount of data processed.
Consider Professional Services for Retail BI Implementation by ScienceSoft
Since 2003, ScienceSoft has helped companies from the retail industry achieve analytics transparency and set up company-wide reporting to aid their decision-making and enhance customer understanding, balance supply and demand, cut operational costs and drive sales. With an in-house PMO and established project management practices, we drive project goals regardless of time and budget constraints, as well as changing requirements.

Retail BI implementation consulting
- Retail BI needs analysis.
- Retail BI solution conceptualization, architecture design and tech stack selection.
- Retail BI implementation planning (milestones, risk management planning, optimal sourcing model, defining KPIs for measuring BI software quality, etc.).
- Business case creation, including cost estimation, time budget estimates.

Retail BI implementation
- Analysis of retail BI needs and drawing up BI software requirements.
- Conceptualization and tech selection for a retail business intelligence solution.
- Iterative retail BI solution development.
- Retail BI solution quality assurance.
- After-launch support and optimization.
About ScienceSoft
ScienceSoft is an IT consulting and software development company headquartered in McKinney, Texas. We help midsize and large companies in retail digitalize their data management and analytics processes and optimize business performance with all-around business intelligence and analytics services. Being ISO 9001 and ISO 27001 certified, ScienceSoft relies on a mature quality management system and guarantees that cooperation with us does not pose any risks to our clients’ data security.
