Data Visualization Consulting Services
ScienceSoft’s consultants help organizations turn complex data into clear, actionable insights. Our data visualization solutions enable teams to spot trends, track progress toward business goals, compare the performance of categories, products, and brands, and explore patterns in ways that drive smarter decisions.

Data visualization consulting helps reveal critical data to business users via intuitive visuals. ScienceSoft provides data visualization advisory, implementation, and support services to help you transform large and complex datasets into appealing visuals to answer your specific business questions and make data-driven decisions promptly and efficiently.
Why ScienceSoft
- Data analytics and data management services since 1989.
- Data warehousing and BI expertise since 2005.
- Big data services since 2013.
- Microsoft Power BI services since 2016.
- Established project management practices to drive projects to their goals regardless of time and budget constraints.
- ISO 9001 and ISO 27001-certified to assure the quality of the data visualization services and the security of client data.
- Expertise in 30+ industries, including healthcare, insurance, investment, banking, lending, retail, ecommerce, manufacturing, transportation and logistics, energy, professional services, telecoms, and more.


Data Visualization Use Cases We Cover
ScienceSoft’s team can help you turn data from diverse sources into immersive visuals, which enables monitoring goals and results, identifying opportunities, predicting demand, and more. These are some of the use cases we cover:
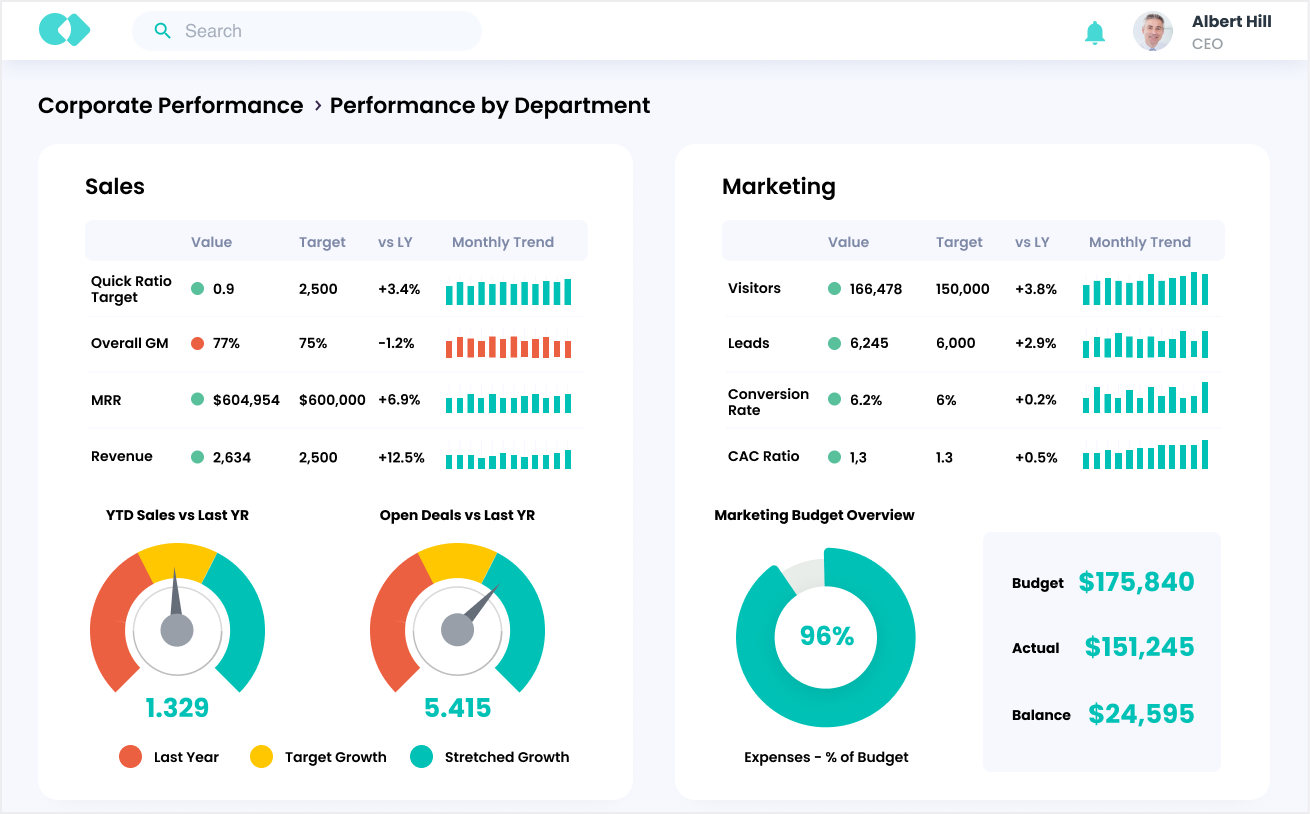
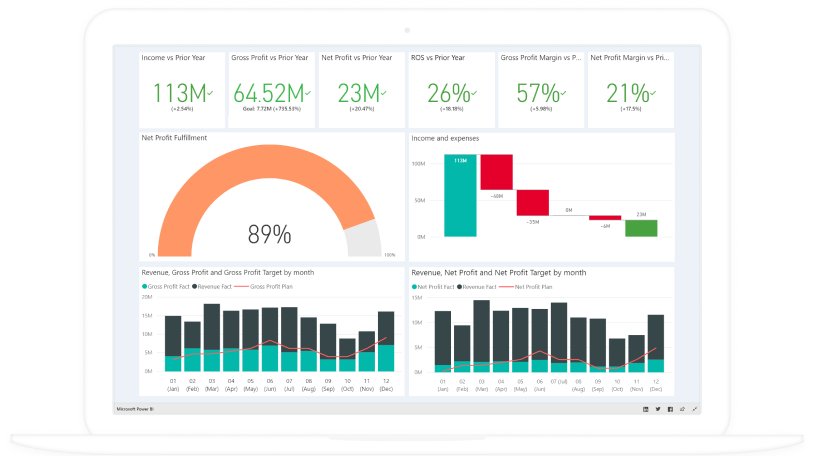
Corporate performance
- Benchmarking financial performance data for revenue optimization strategies.
- Team and employee performance monitoring and analysis.
- Customer and product analytics.
- Procurement analytics, supplier screening and monitoring.
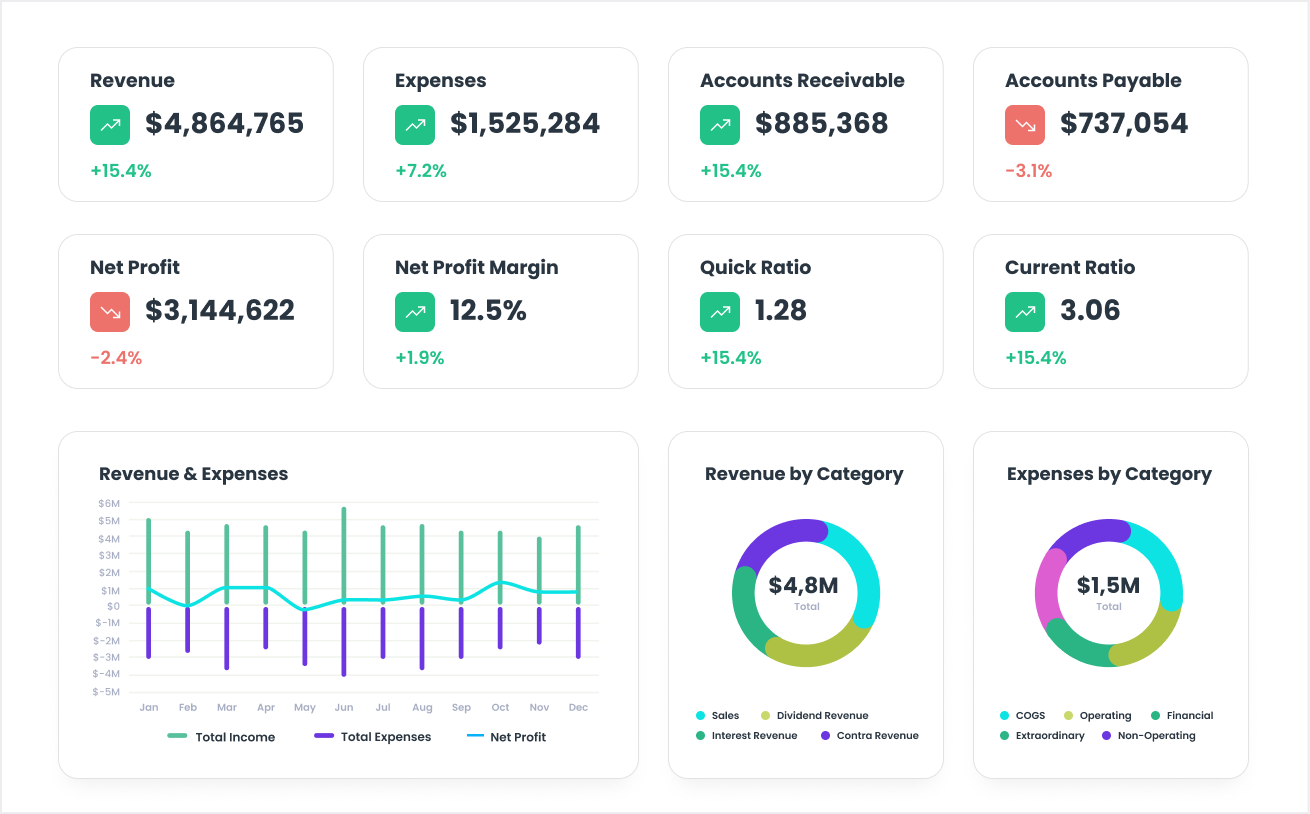
- Tracking a company’s revenue, expenses, and profitability to improve financial forecasting and budget planning.
- Identifying and managing financial risks.
- Financial data monitoring.
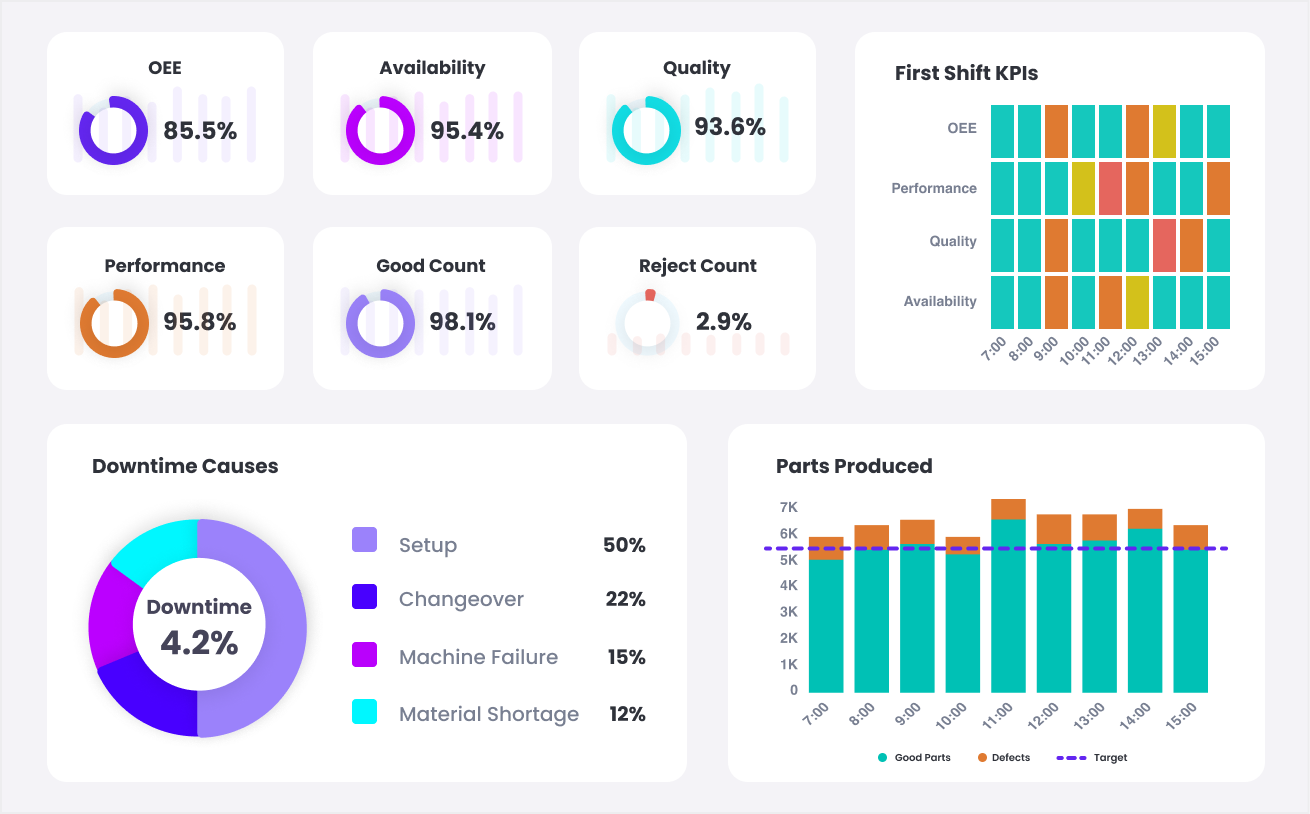
- Monitoring equipment performance to optimize overall equipment effectiveness and manufacturing process quality.
- Uncovering defects in manufacturing processes to speed up product development and improve product quality
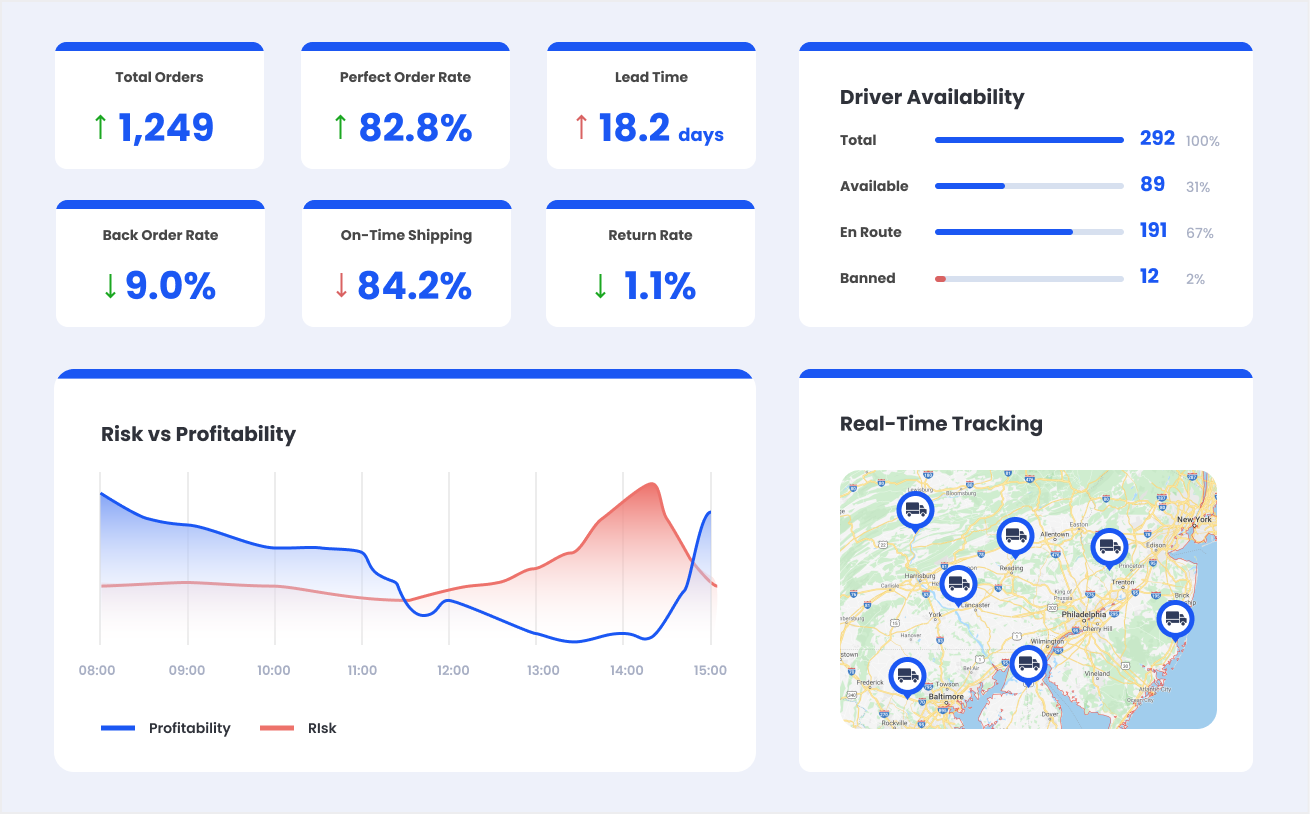
- Identifying demand drivers to improve demand planning accuracy and optimize order management.
- Monitoring procurement data and conducting spend analysis to identify rationalization opportunities.
- Spotting trends and patterns throughout the delivery process to identify and predict risks and optimize the logistics.
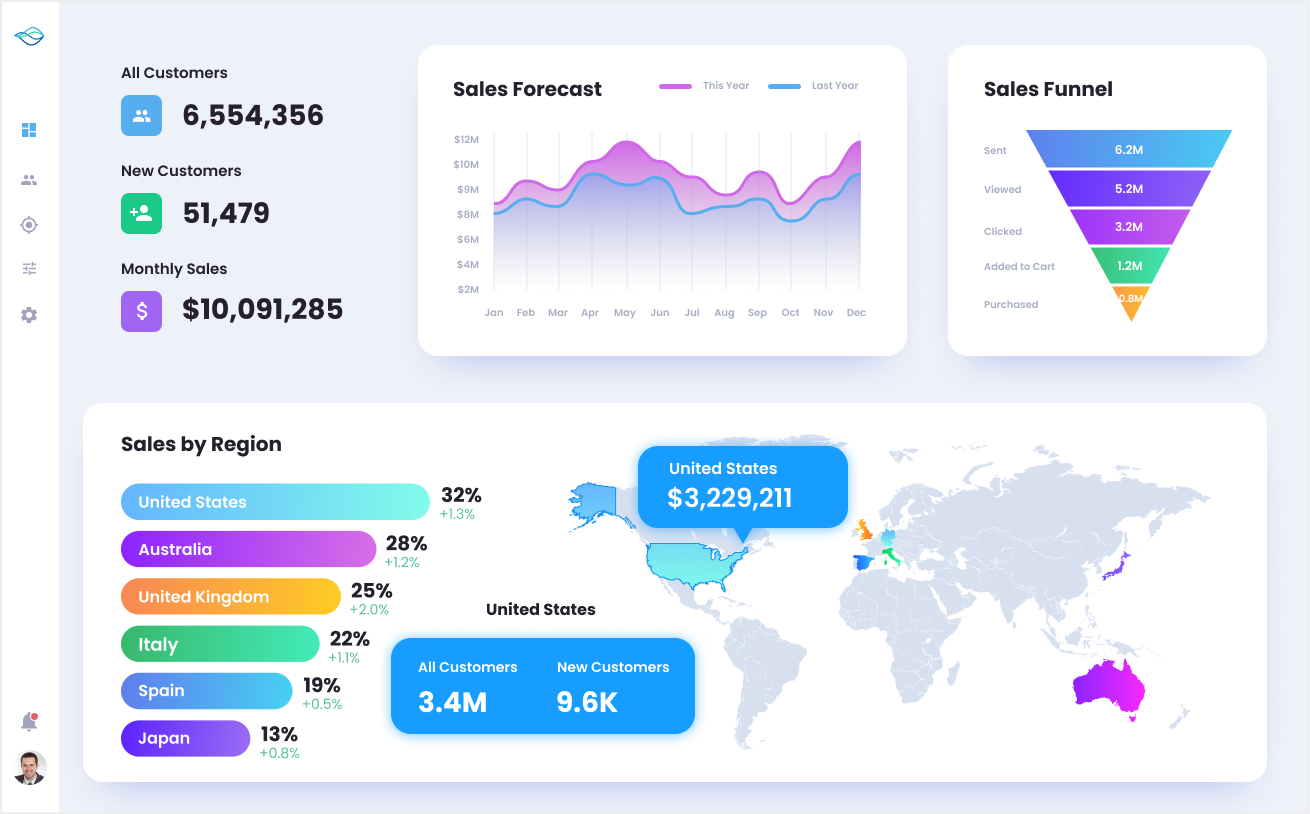
Marketing and sales
- Predicting a prospect’s response to marketing activities for improved planning and optimized budgeting of marketing campaigns.
- Customer segmentation to design personalized marketing campaigns, cross-selling and upselling strategies.
- Customer sentiment analysis to increase product/service quality.
- Customer profitability analysis to optimize the sales funnel.
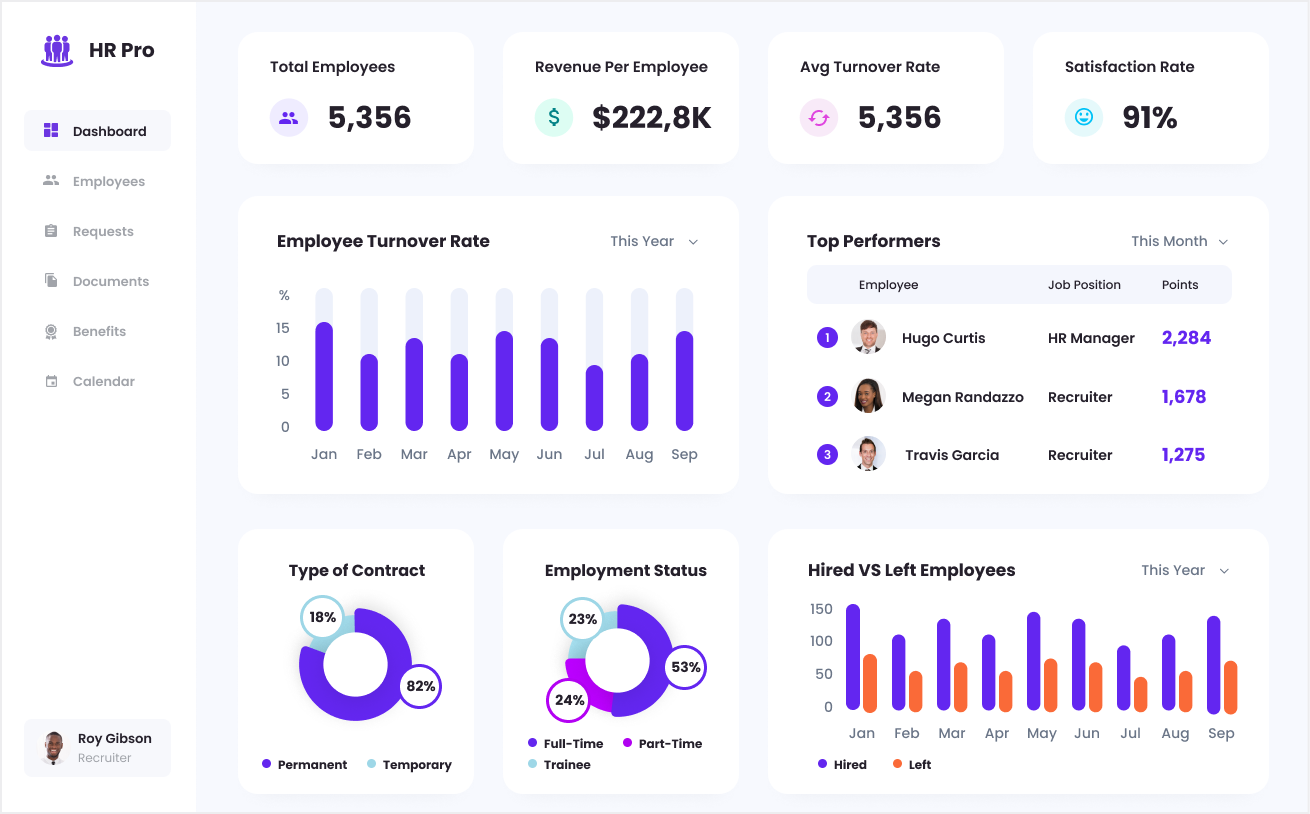
HR
- Keeping track of employees’ activities to determine the performance gaps and devise measures to enhance staff performance.
- Visualizing data for talent management (applicant data, current recruitment needs, best performers, etc.) to make informed decisions within the recruitment process.
- Analyzing retention activities on the employee productivity to identify the employee satisfaction drivers and reduce employee turnover.
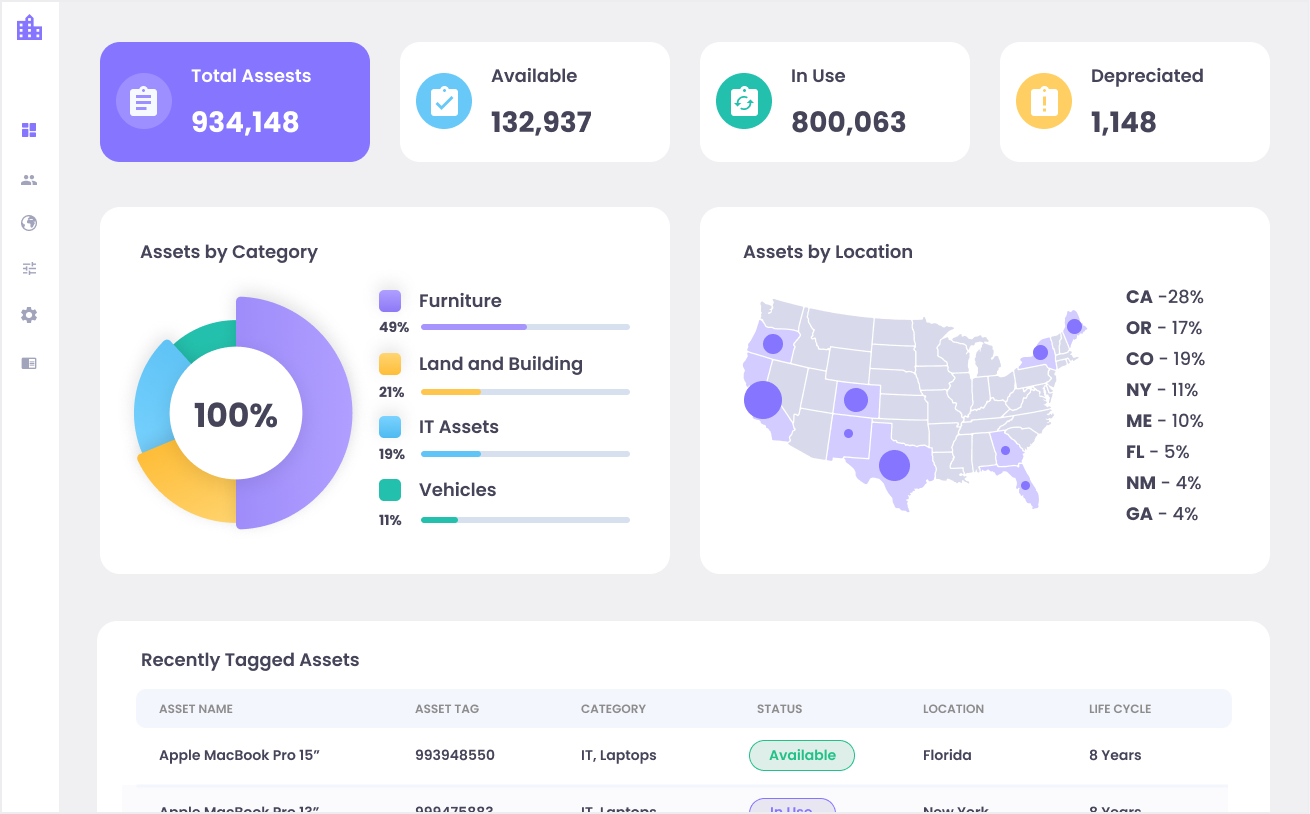
- Asset tracking and monitoring to optimize asset risks and maintenance management.
- Predictive maintenance to enhance the value of critical assets and optimize asset life cycle management.
Data Visualization Techniques We Use
|
Symbol maps |
Line charts |
Bar charts |
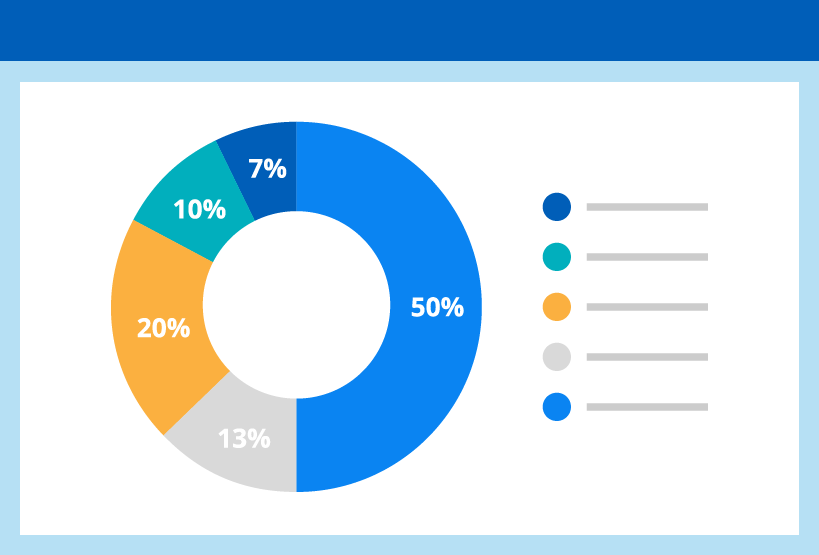
Pie charts |
|
Donut charts |
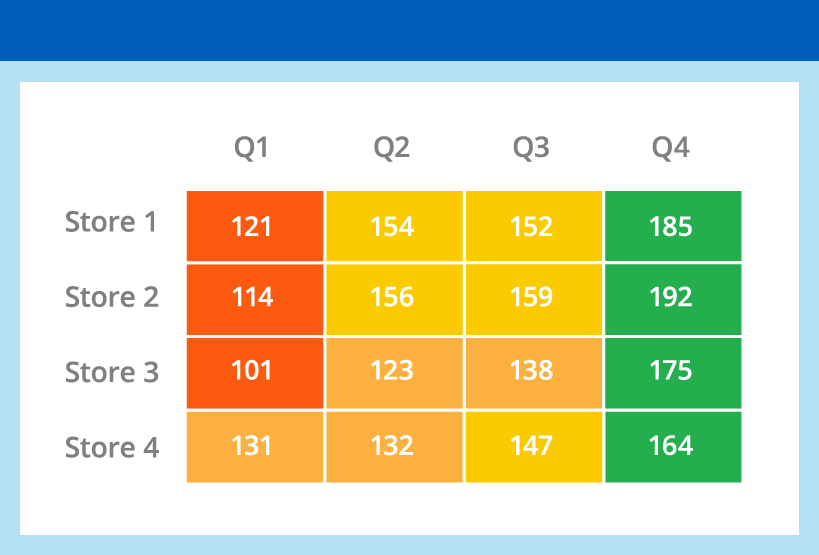
Heat maps |
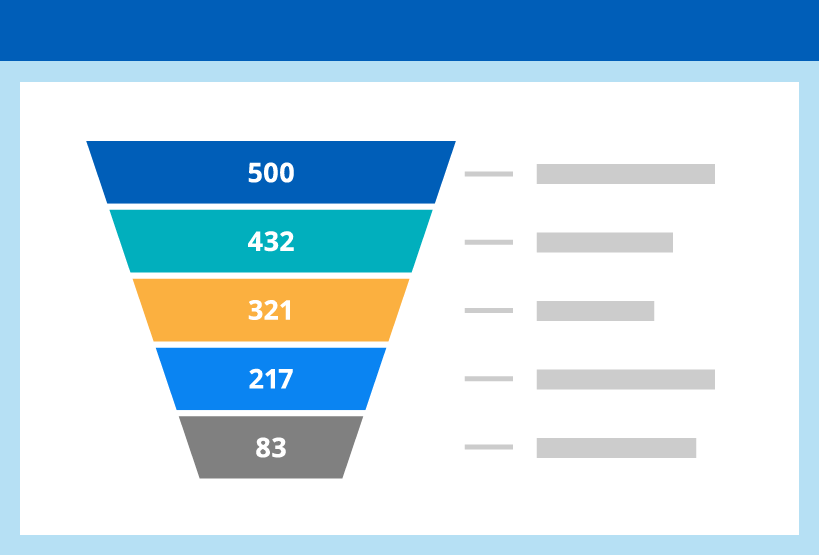
Funnel charts |
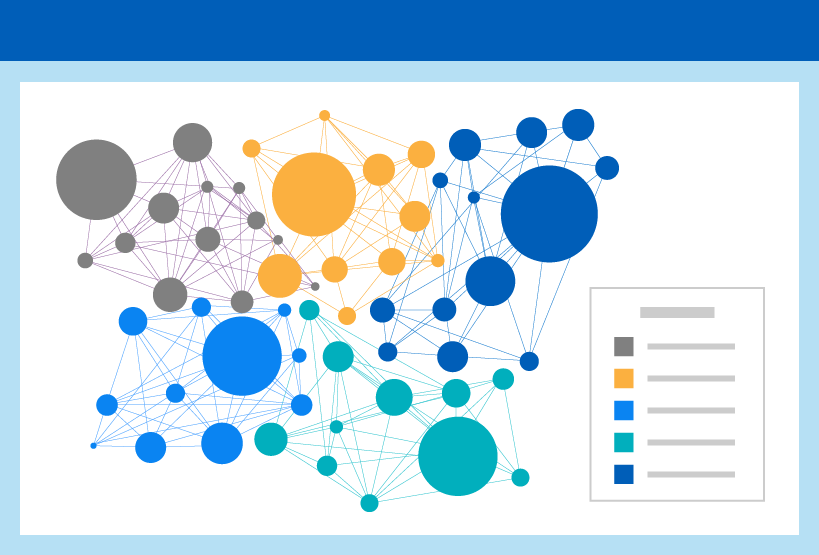
Connectivity charts |
|
Scatterplots |
Sparklines |
Matrices |
Pivot tables |
|
Gauge charts |
Waterfall charts |
Card charts |
Custom charts, etc. |
AI-Driven Power BI Chatbot
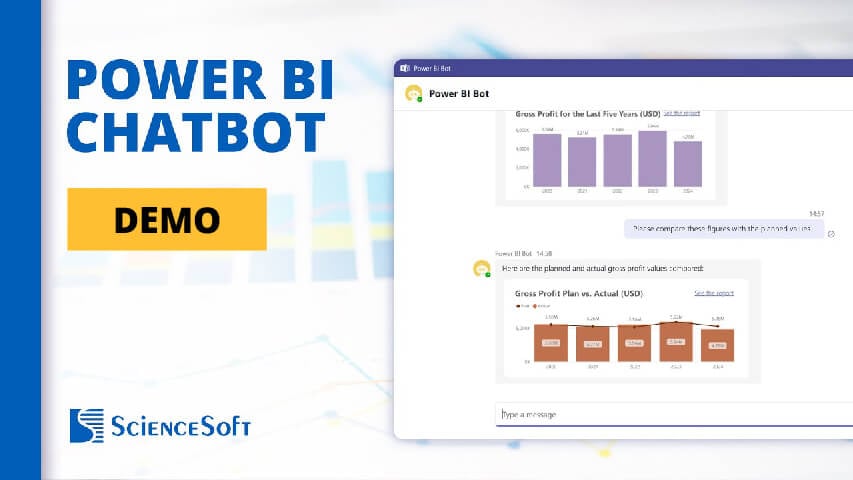
See how Power BI can provide visuals based on natural language requests that users place in Microsoft Teams messenger.
Data Visualization Services We Offer
Reports and dashboards development
We create tailored reports and dashboards for a diverse range of users:
- Strategic dashboards for C-suite managers to monitor KPIs across the company.
- Tactical dashboards for mid-level management.
- Operational dashboards for managers to monitor business processes, identify bottlenecks, etc.
- Analytics dashboards for data experts to identify trends, build forecasts.
Data analytics and BI platform development
To help you aggregate, analyze, and visualize your data, we:
- Set up ETL/ELT processes to integrate data from diverse sources.
- Create a centralized repository, OLAP cubes, etc.
- Implement data security and data quality management.
- Set up data reporting and visualization.
Data visualization optimization
We upgrade your data visualization solution by optimizing it at different architectural layers:
- Data source(s).
- Data model.
- Visualizations (dashboards, reports, paginated reports, etc.).
- Environment (data gateways, access controls, network, etc.).
How We Arrange Our Data Visualization Services
1. Service request analysis
- Data visualization needs elicitation and analysis.
- Collection, documentation, and prioritization of the requirements for future reports & dashboards, an optimized data visualization solution, or a new or upgraded data analytics solution.
2. Service planning
- Data visualization time and budget estimations.
- Data visualization cost-benefit analysis, ROI estimation.
- Data visualization project roadmapping.
- Risk management strategy definition for a data visualization project.
3. Service delivery
Based on the chosen service option, our team delivers:
- Data analytics and data visualization solution design, tech stack selection.
- Optimal dashboards layouts and convenient data representation options for different user roles.
- Data platform components (a data lake, ETL processes for each data source, a data warehouse, OLAP cubes, ML models, reports and dashboards, etc.).
- Data quality management.
- Data security.
- Data platform or data visualization performance tuning and evolution (adding new data sources, configuring additional reports, etc.).
4. Knowledge transfer
- Knowledge transfer to your internal team/outsourced support team.
- Training sessions targeted at each user group with a detailed explanation of the delivered reports and dashboards, components and functions of the data visualization solution or the data platform.
Pricing Options for Data Visualization Services
Fixed price
Best for:
- Small data visualization projects with clear and stable requirements.
- Data platform feasibility study and PoC.
You pay the price established by a contract.
Time & Material, Time & Material with a cap
Best for:
- Data visualization projects with unclear scope.
- Data visualization optimization.
- Advisory data visualization activities (business analysis, data analytics platform solution architecture design, etc.),
You receive the end-of-the-month invoice based on the hours or efforts reported per month (under the stated upper limit in case of T&M with a cap).
Data Visualization Challenges We Solve
![]()
Not insightful reports and unanswered ‘Why?’
We make data visualization an indispensable part of the reporting process and enable decision-makers with the drill-down and filtering options to answer their business questions quickly.
![]()
Overloaded reports and dashboards
We design reports and dashboards ensuring that trends or outliers are recognized immediately, colors are relevant and chart types are consistent.
![]()
Disregarded user roles
We tailor reports and dashboards so that every user can focus on relevant data.
![]()
Limited reporting flexibility
We enable visualization of analytics insights on all devices – PC, mobile, large screens. We can also add BI capabilities to your existing solutions.
Technologies We Master
Data visualization
Microsoft Fabric
Microsoft SQL Server
Microsoft Excel
Google Developers Charts
Tableau
Grafana
Chartist.js
FusionCharts
DataWrapper
Infogram
ChartBlocks
D3.js
Oracle Business Intelligence
MicroStrategy
QlikView
Sisense
Kyubit Business Intelligence
Front-end programming languages
DWH services and databases
Microsoft SQL Server
Microsoft Fabric
Azure Synapse Analytics Amazon RedshiftAmazon RDS
Amazon Aurora
Google BigQuery
Oracle
Snowflake
PostgreSQL
Teradata
SAP IQ
Data storage
Microsoft Fabric
Azure Cosmos DBAzure Blob Storage
Azure Data Lake
Amazon DynamoDBAmazon S3
Amazon RDS
Amazon DocumentDB
Amazon Keyspaces
MongoDB
Clouds
Amazon Web Services
Microsoft Azure
Google Cloud Platform
DigitalOcean
Rackspace Technology
Big data
Apache Hive
Apache ZooKeeper
Apache HBase
Azure Cosmos DB Amazon Redshift Amazon DynamoDBMongoDB
Google Cloud Datastore