Visualize Your Data All Across the Company with Microsoft Power BI

Power BI: Core Concepts
Microsoft Power BI is a collection of tools used to import, aggregate and present data in the form of immersive and easy-to-digest reports and visuals.
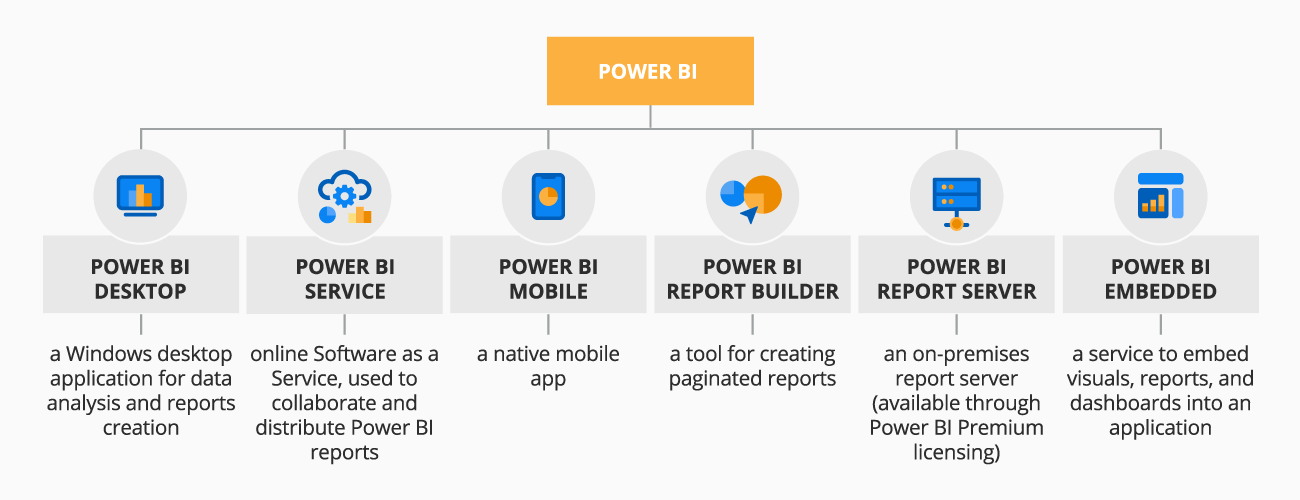
Power BI is recognized as a leader among analytics and BI platforms by the major research companies (Gartner, Forrester, IDC, etc.). Best for data analysis for non-technical business users.
What Features Make Power BI an Industry Leader
Data management
Data ingestion
Ingesting various data structures, including relational data, big data, IoT data, streaming data.
100+ native data source connectors
File data sources, databases, Azure data source ecosystem, online services.
Power BI dataflows
Self-service relational and big data ingestion, cleaning, enrichment, etc.
Integration with Azure Data Lake Storage Gen2
To unify and enable collaboration on data across Power BI and Azure data services.
Analytics
Data modeling
AI-powered data modeling with AutoML, Cognitive Services, Azure ML (Power BI Premium).
The statistical language R support
Using R for preparing data models, reports, data cleansing, advanced data shaping, dataset analytics, etc.
Quick Insights
Speedy search for trends and displaying for an entire dataset.
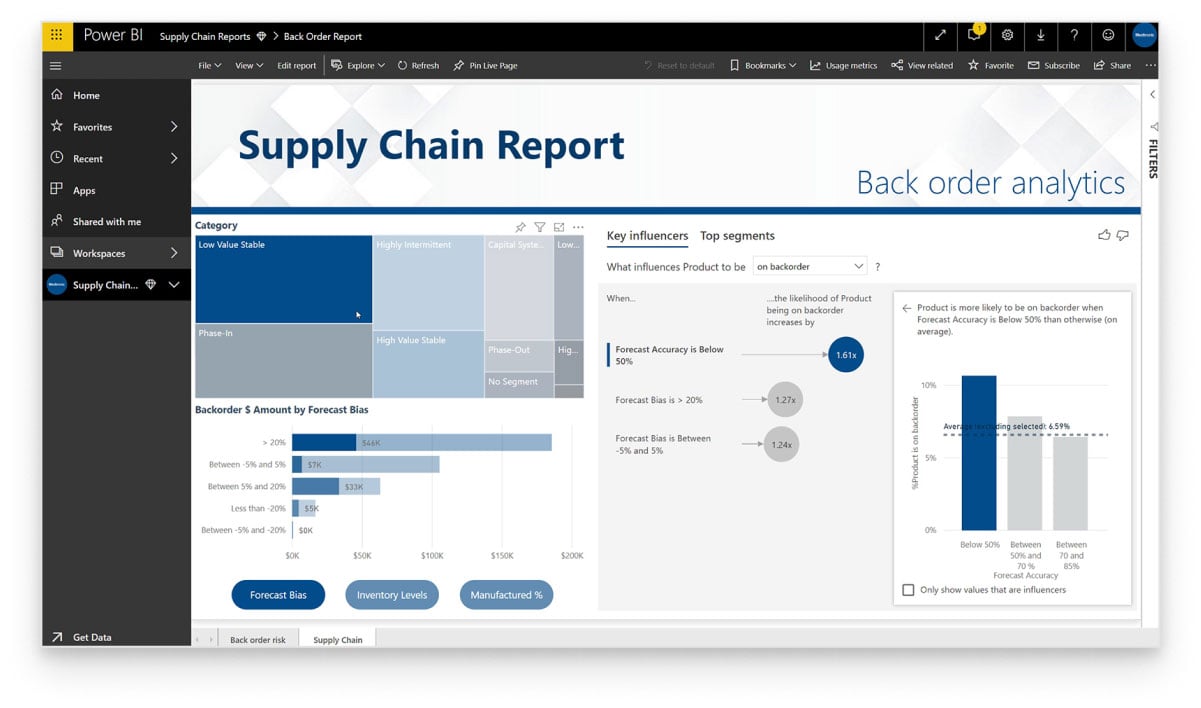
Predictive analytics
Through ML models created in Azure Machine Learning Studio.
Real-time data analytics
Real-time streaming with Power BI REST APIs, Streaming Dataset UI, Azure Stream Analytics to display and update real-time data.
Reporting
Enterprise-wide reporting
Distributing reports preconfigured by analysts across the company.
Scheduled reporting
Periodically delivering reports with the preset values defined by data analysts, BA, etc. at scheduling.
Ad hoc reporting
Self-service reporting on the as-needed basis to answer specific questions.
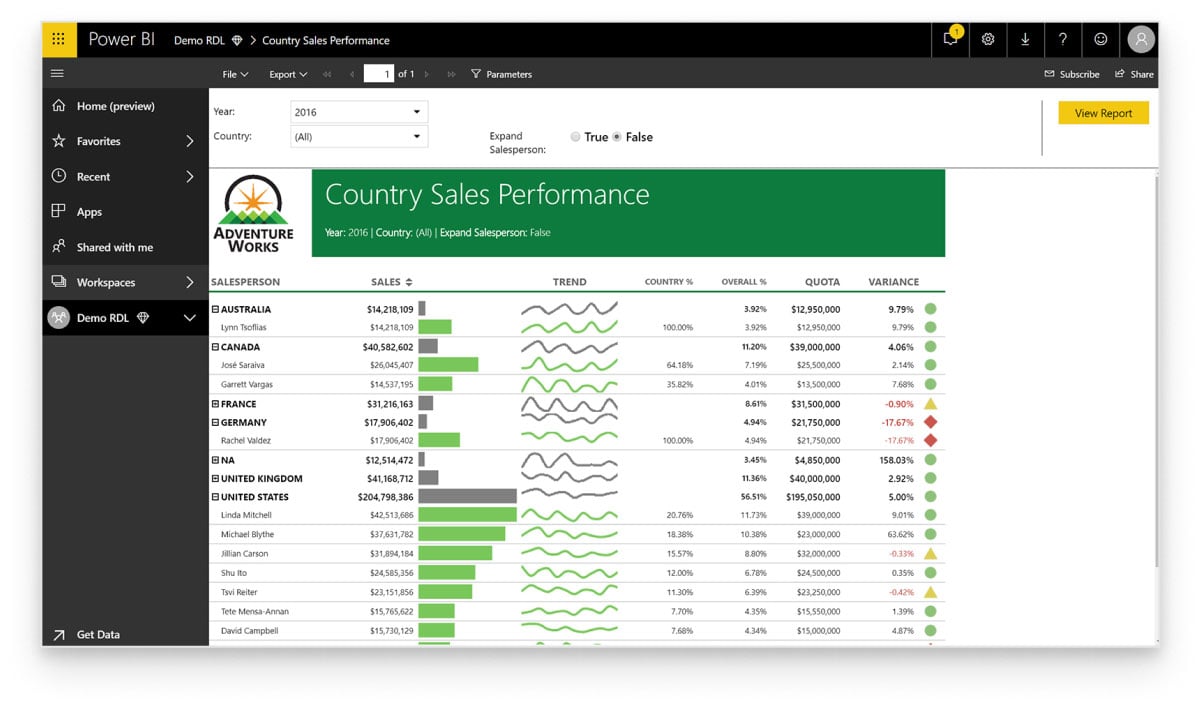
Paginated reporting
Presenting all the required data in a table format.
Mobile reporting
Optimizing Power BI content for mobile users.
Embedded reporting
Incorporating Power BI content into other applications.
Visualization
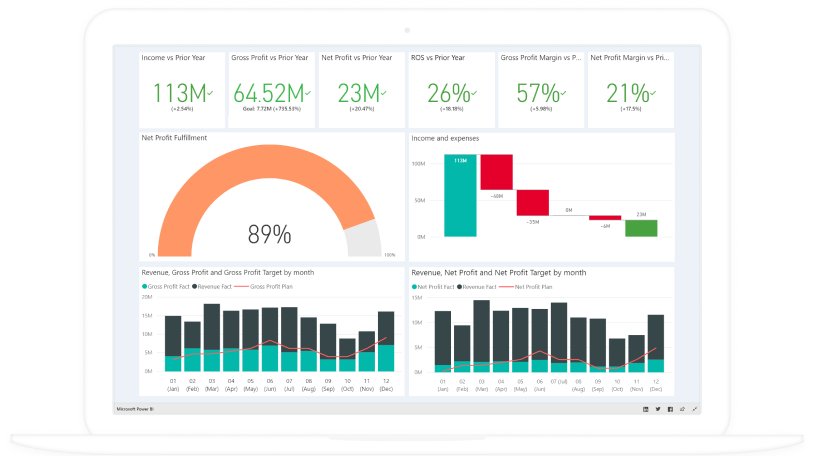
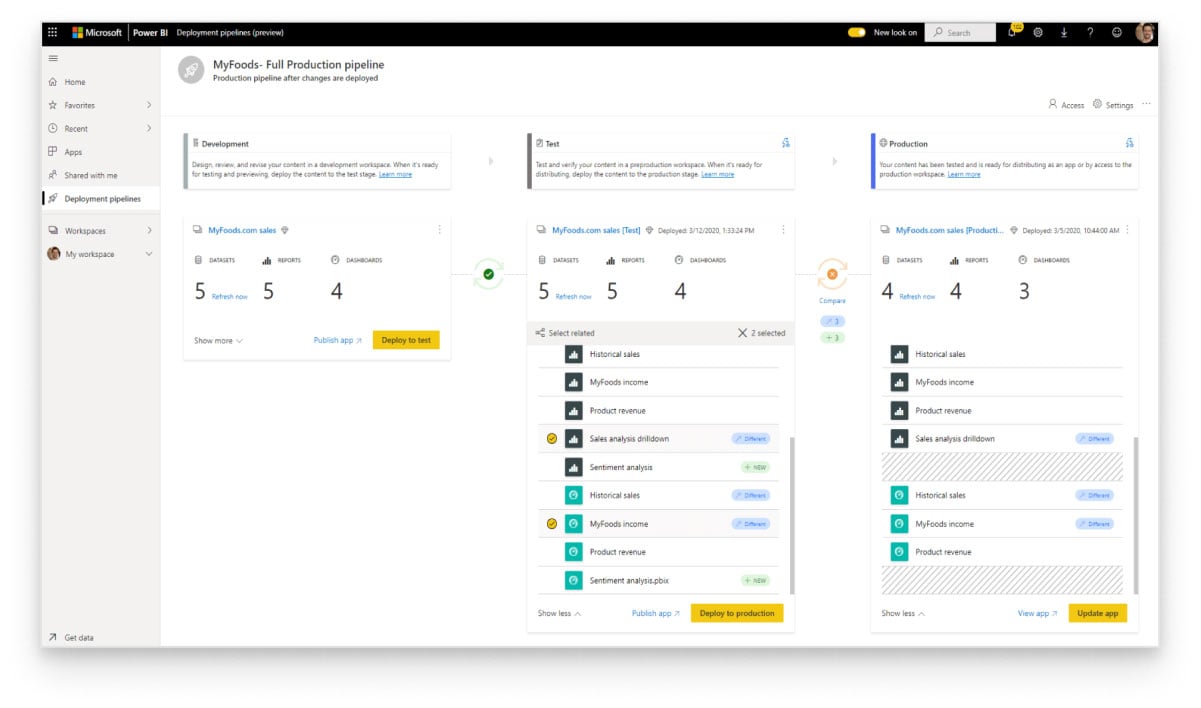
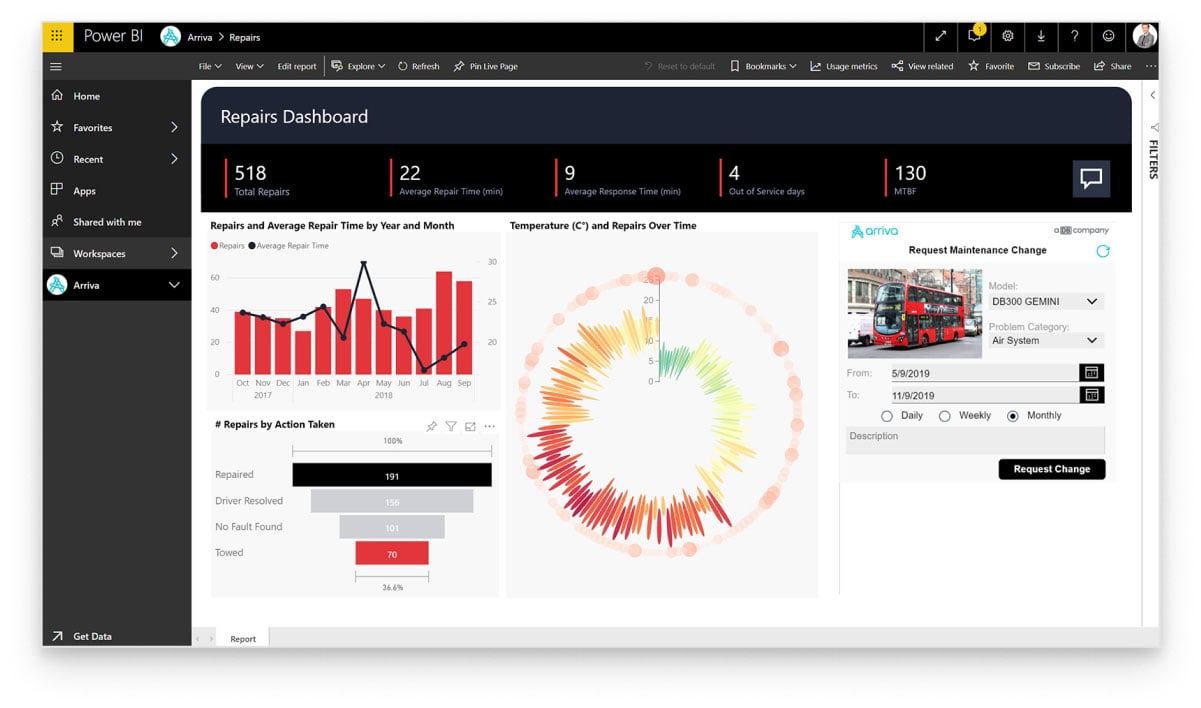
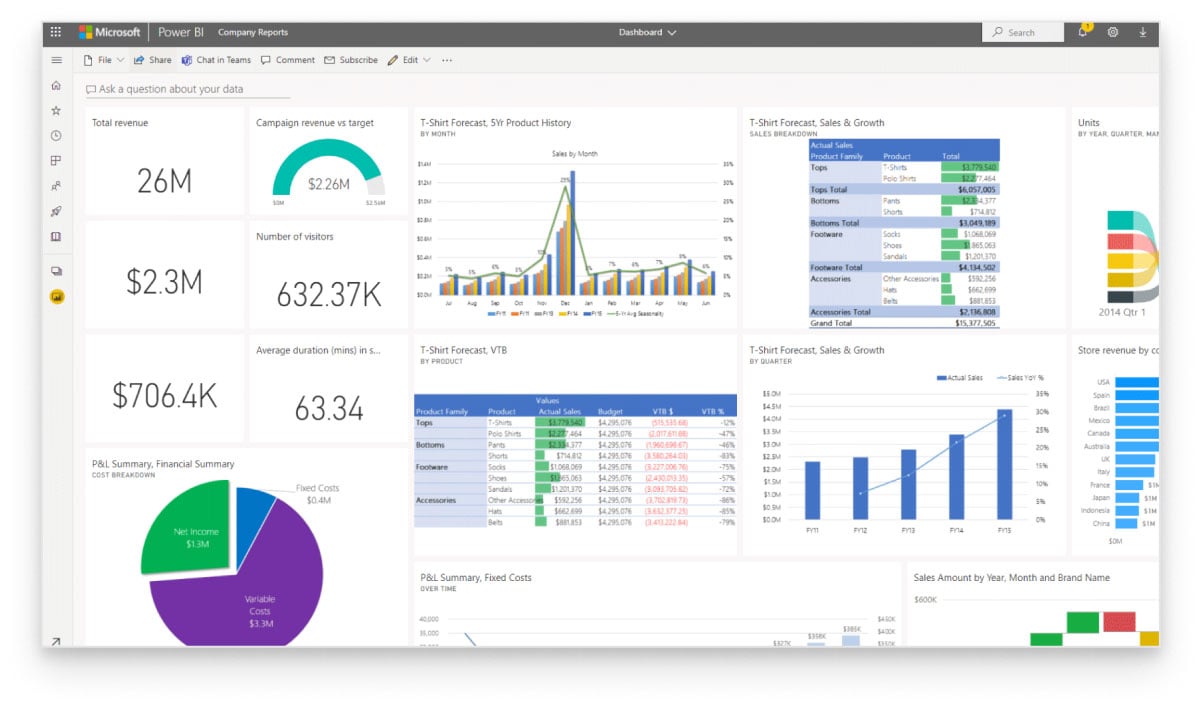
Interactive dashboarding
Presenting a comprehensive visual snapshot of business-critical information in a single location.
Drill-down functionality
Drilling up and down on data points to explore in-depth details about company’s data.
Pre-built visuals
Hundreds of out-of-the-box visuals, including charts, cards, KPIs, maps, matrix, etc. provided by Microsoft and the community.
Custom visuals
Creating proprietary visuals using the Power BI open-source custom visuals framework.
Natural language user interface
Asking natural language questions and getting answers in the form of automatically created visuals and reports.
Security
Data encryption
For data in transit and at rest with Microsoft-managed encryption keys or the ‘bring your own key’ approach.
Workspace-level security
Restricting Power BI content access by publishing it to a separate workspace.
Row-level security
Restricting data access at the row level.
Compliance
Compliance with ISO 27001, ISO 27018, EU Model Clauses, HIPAA BAA, and UK G-Cloud.
Availability in Microsoft national clouds
Meeting additional regulations on service delivery, data residency, access, and control.
Visualize Hidden Insights in Your Data with Power BI
Valuable Integrations for Power BI

Power BI + Enterprise data warehouse
To explore and visualize corporate data stored in a centralized data storage.
Power BI + ERP
To quickly optimize finance and operations related to product planning, manufacturing, sales and marketing and discover new business opportunities.
Power BI + CRM
To overview customer-related data in near-real time to find top sales opportunities and better engage with customers.
Power BI + HRMS
To make data-driven HR decisions for attracting and managing employees, increasing employee productivity, and creating a quality work environment.
Power BI + IoT device management system
To get insight (including real-time) into the functioning of connected products, machinery, buildings, medical devices, etc. to discover new optimization opportunities, etc.
|
|
|
|
|
|
|
Being a Microsoft Power BI Partner, ScienceSoft has been providing consulting, implementation, and support for traditional BI and big data solutions based on Microsoft Power BI since 2016. As an official Microsoft Partner and Cloud Solution Provider, ScienceSoft offers up to 15% off Microsoft licenses and subscriptions. |
|
|
|
|

Solutions Built With Power BI

- Data ingestion from diverse data sources.
- Company-wide data visualization.
- Enterprise-wide data analysis with the possibility to drill down.

- Financial KPI dashboards.
- Revenue, cost and performance analysis.
- Visualization of accounts receivable and accounts payable.
- Financial fraud detection in near-real time.

- Customer profiling and segmentation.
- Leads analytics in near-real time.
- Sales pipeline and sales performance dashboards.

- Business process performance analysis, detecting bottlenecks.
- Performance prediction and forecasting.

- Supply chain management.
- Production optimization.
- Predictive maintenance for in-service equipment.

- Connected devices monitoring and analytics.
- Predictive maintenance and asset optimization.
- Smart cities.

Engineering and scientific analytics
Raw data discovery and visualization for training ML models.

- Visualization of patient personal data, vitals, etc.
- Personalized care plan recommendations.
- Patient management.

Analytics embedded in applications
- Embedded Power BI dashboards, reports, tiles, visuals.
- Building line-of-business applications with embedded analytics.
Value to Obtain With Power BI
![]()
Easy access to analytics insights
As data required for decision-making is easily available, digestible and manipulated, time to insight becomes up to 27% faster compared with traditional BI*. Such improved analytics results in increased revenue, more efficient business processes, faster time to market for products, increased customer satisfaction, lower inventory and supply chain costs.
![]()
Increased business users’ productivity
Power BI self-service tools, intuitive interface and collaboration capabilities improve business users’ productivity and lead to the average time saving of 1.75 h per week.
![]()
Reduced data analysts’ efforts
The automation of data wrangling activities, analytics accelerated with AI-driven engines lead to the self-sufficiency of non-technical business users in conducting data analysis and allows analytics professionals to concentrate on such activities as data management, complex data modeling, advanced data analysis, etc.
![]()
Driving data culture
Delivering business intelligence to business users across the entire company becomes easy and affordable with Power BI Desktop for free and a Power BI Pro version for $9.99/user/month.
* - Source: Forrester
Power BI Products and Pricing
Note: In addition to the plans above, Microsoft also offers Power BI Premium Per User (PPU) at $24 user/month (as of April 2025), which provides many Premium features without requiring a full capacity license.
