Microsoft Power BI: Corporate KPIs at a Glance
Just a couple of meaningful dashboards can tell executives the whole story about their company’s performance and overall health. And here’s our Microsoft Power BI demo to prove it. Take a guided tour to explore how business intelligence helps companies in identifying problems and solving them.
Benefits You Can Get with BI
A robust business intelligence solution coupled with intuitive and carefully considered visualization allows you to:
- Integrate data from disparate systems
A BI solution integrates your data from diverse sources, thus serving as a single source of truth.
- Monitor your company’s performance from different angles
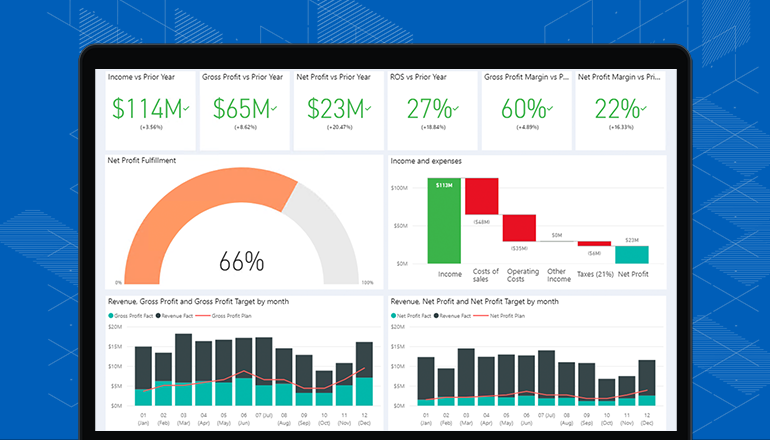
Our BI demo shows how you can check corporate KPIs at different levels and from different perspectives. For example, you can compare the actual gross profit against the target value and the previous year’s value. If you open a dedicated dashboard, you can scrutinize this KPI split by month, state and category.
- Easily identify outliers and spot alarming trends
With no serious effort, you can recognize negative trends as well as outliers among the categories, products or brands. This allows you to quickly get a clear picture of your business’ performance and concentrate on corrective actions.
- Explore details and find problem root causes
With business intelligence, you can identify the root causes of problems and solve them. If required, your solution can be extended with drill downs and filters to make the process faster and easier.
- Give all users the info they need
Usually, dashboards are tailored to different user roles. While our demo is designed for executives, a separate set of dashboards can be developed for sales managers whose burning questions are quite different. For example, they may be interested in analyzing US sales rates in general as well as having a separate look at each store.
The Technology to Get You Going
For our demo, we have chosen Microsoft Power BI. However, you can also consider other data visualization tools, such as Tableau, QlikView, Kyubit BI and Sisense, to name a few.
