QLEAN Overview

To enable high-quality automated checkups of your IBM QRadar deployment, we developed QLEAN (also known as Health Check Framework for QRadar), the most advanced QRadar health check and LEAN SOC automation solution to proactively improve SIEM performance and maintenance
QLEAN is the solution developed by ScienceSoft to continuously monitor IBM® Security QRadar® SIEM, including all-in-One and distributed environments. It provides security specialists with over 50 performance metrics and 25 health markers to analyze QRadar’s operability, reveal configurational and functional issues, and therefore enhance the overall efficiency of a SIEM system.
Upon the end of the checkup, QLEAN generates a comprehensive health check report that helps security specialists assess the current state of their SIEM solution, detect abnormalities and carry out remediating actions relying on recommendations provided in the report. This way, the tool helps security teams to fine-tune QRadar continuously, tweak the system according to a specific IT environment, and as a result, enable a better visibility of security events and real-time offenses, thus ensuring a more robust protection of the entire network, its critical nodes, and sensitive data.
Licensing
The fully functioning QLEAN is activated through a valid license key provided by ScienceSoft upon a one-time payment. The license cost depends on the QRadar EPS (Event Per Second) rate.
Additionally, ScienceSoft’s SIEM consultants provide support services that include regular updates, bug fixes and new features to QLEAN users.
The tool is also available in a free demo mode with limited functionality. No license is required to run QLEAN in the free demo mode.
Deployment
QLEAN installs directly on your QRadar console. There are multiple ways to deploy QLEAN depending on your configuration preferences.
Reports
QLEAN generates one comprehensive report per check-up for security administrators and analysts to observe QRadar’s state at different angles through a number of tabs.
The report includes details on the QRadar deployment that are either unavailable in QRadar itself or requires security professionals’ substantial efforts to be elicited from QRadar. This way, QLEAN facilitates SIEM monitoring substantially while saving security professionals’ time and efforts.
Security professionals can run the report at any time and use custom settings to schedule it for a needed period of time (daily, weekly and monthly reports). The report is automatically emailed to the QLEAN administrators.
Ready to test QLEAN capabilities?
Fill in the form and get your free trial!
Reporting Tabs
Reporting tabs are arranged into four sections: Generic, Deployment, Environment and Correlation.
Generic
This tab provides basic information about QRadar Console (IP address, UUID, version, version history). In addition, it shows the list of users and their roles.
Deployment
QRadar hosts
QLEAN provides a comprehensive overview of QRadar deployment, including high-availability (HA). This tab shows the state of managed hosts and notifies security specialists in case a host fails. QLEAN also captures synchronization between hosts, notifies security admins when a host requires software upgrade or is being upgraded, as well as delivers such data as:
- Host uptime, which specifies the number of days the host has been active.
- Average CPU load that shows how much CPU the host occupies.
- Total RAM, that is the total RAM storage for an active host.
- Free RAM that shows RAM availability for an active host.
- Disk usage details per host.
System health
Here you’ll find information on the following:
- Recent backups to analyze if backups are performed successfully and in a timely manner, check if there are no auto backup issues.
- Integrity of events and flows for recent 24 hours. These sections allow security specialists to check file hash and verify that event and flow logs were not modified. Failed or corrupted event and flow files will indicate a malicious activity and inform about the risk to lose data and/or access to it.
- Last warnings and errors from system notification section provides warnings and errors from a particular IP address with the date and its detailed description.
- Last auto update errors help to uncover recent QRadar packages that were installed unsuccessfully. Detected issues prompt security admins to review recent auto updates and reinstall or download missing software dependencies.
Environment
EPS/FPI per managed host
This tab provides a 24-hour EPS/FPM statistics per managed host within the QRadar deployment. Since different hosts may have different license limits and their performance may vary, this information can be used as a guideline to distribute QRadar licenses correctly, ensure the right EPS and FPM split across QRadar hosts and achieve QRadar’s better productivity.
Raw inbound EPS per managed host
The tab shows average and peak performance of event processors over a certain period of time. It allows comparing the average and peak EPS and detecting if it ever crosses the licensing limit. This way, the graphs help security analysts to reconsider QRadar licensing, as well as analyze what log sources and event types provoke EPS spikes, check log sources for potential misconfigurations and set their activity within certain periods of time.
Raw inbound FPM per managed host
Similar to the logic of the previous tab, Raw inbound FPM per managed host allows analyzing variations in FPM per QRadar flow processor. Relying on peak FPM indicators, security teams can not only plan the QRadar license upgrade but also identify malicious activity and carry out a detailed investigation of the detected abnormality through other tabs.
Log sources
QLEAN delivers detailed information about all the log sources connected to QRadar compiled on a single page. The tool brings together such parameters as Source Name and Type, Log Source Activity (active/inactive) and Status (enabled/disabled), Log Source Groups, Log Source Addition time and type (manual or automatic), and much more. Using the tab, security specialists can quickly sort, search and filter through all the log sources, which is extremely time-consuming if fulfilled with standard QRadar capabilities.
The tab can be extended by clicking the [+] sign on the side bar. It lets security teams dive into the state of log sources; track active, inactive, disabled log sources; see added, modified and deleted log sources, as well as protocol configuration errors.
The information from the tab helps to detect various issues, for example by:
- Registering a sudden drop in the number of active log sources, which can indicate that log sources have been deleted or disabled.
- Understanding if extra licensing support is required or the system is close to reaching its license limit of active log sources.
- Seeing if all the critical system log sources are sending logs permanently, track pauses in logs processing and discover malfunctioning log sources.
- Investigating modifications to log sources and detect potentially malicious activity.
Data quality by device type
The tab reports on the quality of data received from different device types connected to QRadar. By navigating across Average Severity, Seen, Supported, Count and Coverage columns, users can assess data quality for various event categories and see how many of all the supported event categories related to a particular device type have been successfully identified by QRadar.
Comparing the number of identified event types with the number of supported ones, security teams can detect if QRadar misses particular event types, which can point to audit flaws, unsupported events, misconfigured log sources that send non-normalized data, etc.).
Data quality by log source
The tab reports the quality of data received from different log sources connected to QRadar and shows Log Source Name, Average Severity of all the events characteristic to a particular log source, the overall number of events supported by QRadar, the share of event types identified by QRadar, log sources with the best and worst event coverage for the last 24 hours, and more.
This allows identifying misconfigured log sources, the percentage of overlooked logs and events and start log source fine-tuning promptly.
Unknown events and sources
The tab shows all the events that are collected but are not properly normalized and parsed by QRadar, hence do not bring any value and can’t be used to identify real offenses. The tab also lists all the log sources and device types that send data but are not properly discovered or identified by QRadar. Comparing the total number of event types corresponding to a particular log source or a device type with the number of normalized and parsed events, security admins can easily identify those types of devices and log sources that have issues, for example:
- A wrongly assigned type of device or log source.
- Recent changes in the log source event format, which requires uDSM/LSX update.
- Two device types with the same LSI, unique ID that QRadar uses to identify a log source, and others.
Using the information from the tab, security specialists can ensure that all log sources and devices are properly identified and then fine-tune log sources respectively by creating relevant uDSM/LSXs.
Runtime statistics
To detect errors in incoming data processing and estimate the required storage space, security specialists take advantage of these metrics that include:
- Event Statistics: Event Average Payload Size, Event Average Rate, Event Average Record Size, Event Dropped Records Count, Event Processed Records Count, Events Received, Events Parsed, Events Normalized Properly, Events Unrecognized, Events Aborted with Exception, Average Event Parse Time.
- Flow Statistics: Flow Average Payload Size, Flow Average Rate, Flow Average Record Size, Flow Dropped Records Count, Flow Records Dropped.
Assets
The tab shows the total number of network assets. In addition, information security specialists see a diagram with the most risky assets. Each asset has its own risk level and vulnerabilities count. By default, there are top 10 risky assets, but users can customize the tab by increasing or decreasing the number of assets.
Correlation
Offenses
The tab lists the offenses with the maximum number of events involved. The tab allows analyzing identified offenses, see their unique ID and source IP, as well as to discover which correlation rules exactly generated an offense. This way, security professionals can track ongoing attacks and identify improperly tuned correlation rules that generate false positives, then eliminate them.
Rules
Listing enabled, disabled, modified and custom rules and building blocks that exist in the system, QLEAN enables security admins and analysts to follow correlation rules performance through such metrics as Fired Rules Count, Rules Average Execution Time, Top Average Action Time, Top Average Response Time, Top Average Execution Time.
These metrics allow security teams to assess if the system contains:
- Incorrectly created correlation rules.
- Improperly fine-tuned rules.
- Heavy rules that include irrelevant building blocks and thus overload the system.
- False-positives that should be eliminated, and more.
Reports
QLEAN helps to identify QRadar reports with the execution time exceeding the initially estimated timeframes fixed in QRadar. The most time-consuming reports can point to changes in incoming data, modifications to QRadar filters or search criteria.
At the same time, QLEAN overviews Modified Searches, providing Search Name, Modification Date and the User who modified a particular search, which allows performing the further investigation of a heavy report issue.
Health Markers
Security specialists get the health check report in an email that will also contain 25 “OK/Failed” Health Markers indicating important metrics of the QRadar deployment. If a marker fires, QLEAN generates a warning that describes a particular issue and provides recommendations on how to eliminate it.
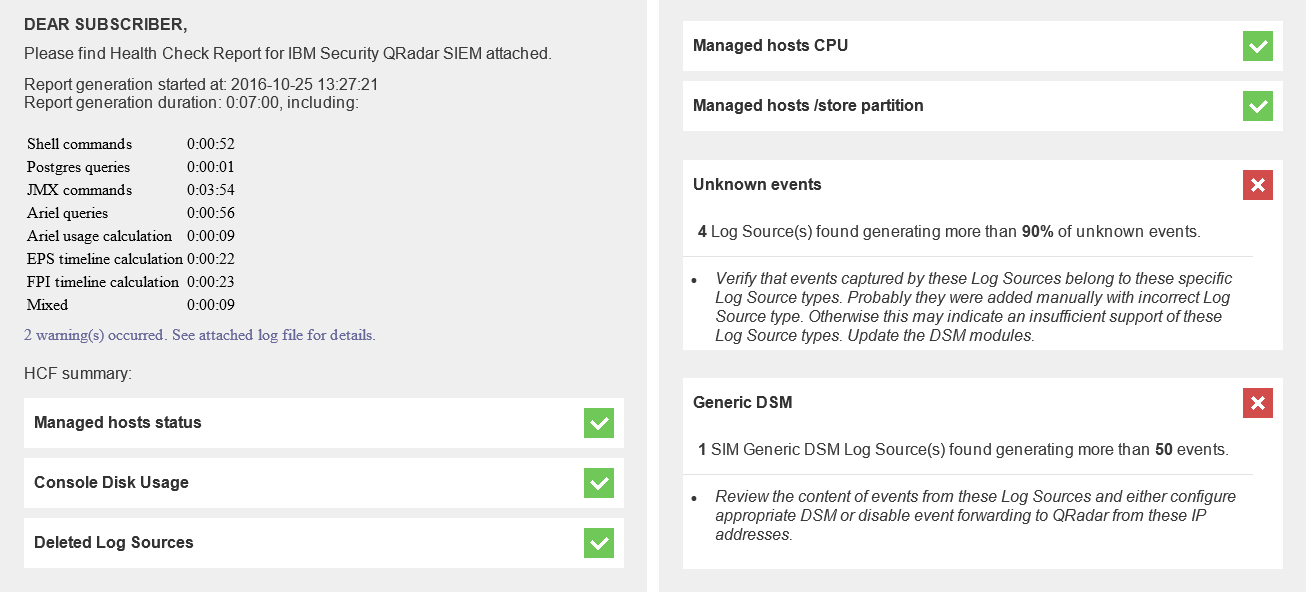
The list of health markers:
- Console Disk Usage: if the used disk space of the QRadar Console exceeds the established threshold.
- Deleted Log Sources: if at least one log source was deleted over a certain period of time.
- Modified Log Sources: if at least one log source was modified over a certain period of time.
- Auto Update Errors: if at least one auto update failed over a certain period of time.
- Asset Risk Level: if at least one asset reached/exceeded the established risk level.
- Offense Types: if at least one offense type exceeds the average established frequency.
- Nightly Backups: if any failures occurred during the last 5 backups.
- System Notifications: if at least one error/warning was detected in System Notifications journal over a certain period of time.
- Inactive Log Sources: if at least one log source became inactive over a certain period of time.
- Disabled Log Sources: if at least one log source was disabled over a certain period of time.
- Protocol Errors: if at least one log source has a protocol configuration error.
- Modified Searches: if at least one search was modified over a certain period of time.
- Data Integrity: if at least one event data file was corrupted or integrity check is failed.
- Data Integrity: if at least one flow data file was corrupted or integrity check is failed.
- Rules Execution Time: if at least one correlation rule exceeds the established execution threshold.
- Rules Response Time: if at least one correlation rule exceeds the established response threshold.
- Reports Execution Time: if at least one report exceeds the established execution threshold.
- Distributed EPS: if at least one managed host reached or exceeded the established EPS utilization threshold.
- Distributed FPM: if at least one managed host reached or exceeded the established FPM utilization threshold.
- Managed Hosts RAM: if at least one managed host runs below the established amount of free RAM.
- Managed Hosts CPU: if the CPU load of at least one managed host exceeds the established threshold within the last 15 minutes.
- Managed Hosts/Store Partition: if the used/store partition space of at least one managed host exceeds the established threshold.
- Managed Hosts Status: if the state of at least one managed host is different from Active or Standby.
- Generic DSM: if at least one SIM Generic DSM Log Source generates more events than the established threshold.
- Unknown Events: if at least one Log Source generates more unknown events than the established threshold.
QLEAN Value
Providing extensive data on QRadar operability and effectiveness, QLEAN brings various benefits for security professionals, security decision makers and IBM business partners.
![]()
For security teams
- Better control over QRadar deployments
- Increased log data quality
- Reduced manual routine
- Prompt diagnostics of security attacks and threats
- Improved EPS license capacity utilization
- Host overload protection
![]()
For security decision makers
- Improved visibility of security events
- Less time, efforts and budget spent on QRadar tuning
- Improved effectiveness of security teams and SOCs
- Higher ROI from QRadar
- Efficient planning and management of QRadar investments
![]()
For IBM business partners
- Improved performance and effectiveness of QRadar consultants
- Increased customer satisfaction with QRadar
- Reduced customer attrition
- New upsell and cross-sell opportunities
Why ScienceSoft?
In cybersecurity services since 2003, ScienceSoft has been delivering SIEM services and solutions all over the world.
- 200+ projects in information security.
- A competent team of Certified Security Professionals.
- Proprietory information security tools that suit businesses of any scale and industry where information security is the priority, including: Healthcare, Banking and Finances, Public Sector, Telecommunications and more.