Implementing AWS Monitoring for Efficient Cloud Management

Related topics:
5 min read
Last updated:
Editor’s note: If you are having trouble with the performance and stability of your apps within the AWS infrastructure or struggling to keep up with your current AWS monitoring system’s complexity, it’s highly possible you’ve chosen the wrong approach to monitoring. Continue reading the article and reach out to us for managed AWS services to set up efficient monitoring.
As AWS-based applications become more complex and grow deeper into your business’ IT infrastructure, it’s important to make sure they run as expected, always stay online and interact properly with other infrastructure components. Find helpful recommendations on monitoring taken from ScienceSoft’s professional experience as you read further.
ScienceSoft’s approach to AWS monitoring
Performance management of AWS applications strongly relies on monitoring metrics that help to:
- Streamline troubleshooting and issue resolution.
- Minimize the occurrence of runtime errors
- Optimize AWS resource consumption.
- Make sure that your cloud apps are always online.
To reap these benefits and easily integrate AWS monitoring into your company’s IT processes, ScienceSoft suggests following best practices and opting for the approach where simplicity and performance are key. It centers on tracking real incidents with rules that are as simple, predictable, and reliable as possible.
Key metrics for monitoring we recommend
A common mistake that companies with little experience in AWS monitoring make is trying to track as many metrics as possible, creating an overly complex system that is hard to maintain. ScienceSoft’s team of cloud support experts starts implementing monitoring by identifying the resources and events that affect the performance of your cloud applications. Our approach has a lot in common with Google’s “golden signals” and we recommend the following key metrics for monitoring:
- Latency: the time it takes to respond to a user request.
- Traffic: the number of user requests over a unit of time (usually per second).
- Errors: the number of requests that fail
- Saturation: measurement of how efficiently your resources are consumed.
Our team uses these key metrics as a basis and adds new indicators as we build up the system. The key here is to focus on tracking issues that actually affect your cloud applications’ performance and avoid collecting redundant metrics.
Our guide to applying monitoring rules
Rules form the architecture of your monitoring system. Here are some basic guidelines from our DevOps experts on rule creation:
- Monitored conditions should be urgent, actionable, and affect users.
- Defined rules should detect an otherwise unnoticed, unrecognizable condition.
- Rules should set alerts only for personnel entitled to resolve the type of issue at hand.
- Alerts and notifications should be reduced to a reasonable minimum.
- Responses to alerts should be automated to minimize human intervention.
AWS security monitoring as a key aspect of our approach
Another key aspect of ScienceSoft’s monitoring approach is addressing your AWS system’s security issues. AWS Cloud infrastructure security issues vary from industry to industry, but the core principle stays the same. You need to have strong control over access and permissions for your AWS account, as well as for specific AWS resources.
Recommended tools for AWS monitoring
For implementing AWS monitoring, ScienceSoft applies Amazon CloudWatch, Zabbix, Nagios, and Prometheus. The right combination of these tools depends on a particular case.
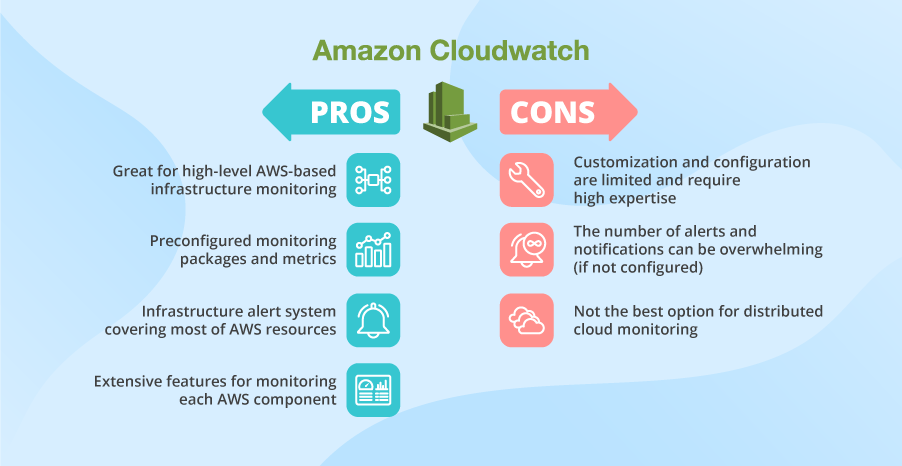
Is Amazon CloudWatch* enough?
CloudWatch offers deep integration with AWS services, it’s flexible, and provides extensive dashboarding functionality. It offers automatically configured monitoring starter packages with metrics that cover the minimum amount of resources needed to track your system’s health. It can also be used to monitor almost any AWS resource if properly configured.
However, customization and configuration of CloudWatch demand high qualification. In order to configure alerts and limit the number of notifications you get to a reasonable minimum, you will require highly technical staff. CloudWatch does not provide any guidance or recommendations to perform these tasks. Another one of its downsides is that it does not provide a single overview dashboard, but multiple dashboards are used in combination. Creating additional dashboards increases the costs of your subscription.
Our DevOps experts find that ClowdWatch works well if you have your entire infrastructure on AWS. If you are running under multi-cloud, hybrid architecture, then opting for third-party tools will be a better option.
When and how third-party tools may help
Both Zabbix and Nagios are great in terms of customizations. Zabbix is a distributed monitoring solution, so it works well for multi-cloud environments. It also provides an overview dashboard with data from multiple sources consolidated into one view for you to track your AWS system’s health. Prometheus enables monitoring of containerized environments and can be used to manage your Kubernetes/EKS clusters. It also has convenient dashboarding tools that allow for easy customization.
A case of successful monitoring implementation
Monitoring is often perceived as a purely technical task. Let us give you an example of how monitoring can bring business benefits. Using the approach to AWS monitoring described above, ScienceSoft optimized our client’s resource allocation and consumption, decreased downtimes by 65%, and decreased response time to system faults by 70%. This seriously increased the overall application performance. We used Zabbix for monitoring purposes along with the ELK stack for their web application log management. As a result of improved performance and stability of their ecommerce solution, the client enjoys the increased traffic of users and a lower bounce rate.
Implementing AWS monitoring for your business
A proper approach to AWS monitoring allows you to avoid such problems as occasional downtimes, improperly answered user requests and security issues. However, implementing efficient monitoring for your AWS-based infrastructure requires deep technical knowledge and expertise in cloud management. By taking advantage of ScienceSoft's 13+ years of experience in providing managed AWS services, you can lift this burden off your shoulders. You are welcome to task us to set up your AWS monitoring.
*Amazon CloudWatch is a trademark of Amazon.com, Inc. or its affiliates in the United States and/or other countries.
